
UNITED STATES
SECURITIES AND EXCHANGE COMMISSION
Washington, D.C. 20549
___________________________________
FORM 8-K
___________________________________
CURRENT REPORT
Pursuant to Section 13 or 15(d)
of the Securities Exchange Act of 1934
Date of Report (date of earliest event reported): October 29, 2026
___________________________________
(Exact name of registrant as specified in its charter)
___________________________________
(State or other jurisdiction of incorporation or organization) | (Commission File Number) | (I.R.S. Employer Identification Number) | ||||||
(Address of principal executive offices and zip code) | ||||||||
( | ||||||||
(Registrant's telephone number, including area code) | ||||||||
___________________________________
Check the appropriate box below if the Form 8-K filing is intended to simultaneously satisfy the filing obligation of the registrant under any of the following provisions:
Written communications pursuant to Rule 425 under the Securities Act (17 CFR 230.425) | |||||
Soliciting material pursuant to Rule 14a-12 under the Exchange Act (17 CFR 240.14a-12) | |||||
Pre-commencement communications pursuant to Rule 14d-2(b) under the Exchange Act (17 CFR 240.14d-2(b)) | |||||
Pre-commencement communications pursuant to Rule 13e-4(c) under the Exchange Act (17 CFR 240.13e-4(c)) | |||||
Securities registered pursuant to Section 12(b) of the Act: | ||||||||
Title of each class | Trading Symbol | Name of each exchange on which registered | ||||||
Indicate by check mark whether the registrant is an emerging growth company as defined in Rule 12b-2 of the Exchange Act.
Emerging growth company x
If an emerging growth company, indicate by check mark if the registrant has elected not to use the extended transition period for complying with any new or revised financial accounting standards provided pursuant to Section 13(a) of the Exchange Act. o
Item 2.02. Results of Operations and Financial Condition.
On October 29, 2026, Forbright, Inc. (the “Company”) issued a press release announcing financial results for the third quarter ended September 30, 2026.
A copy of the press release is furnished herewith as Exhibit 99.1 and is incorporated by reference herein.
Item 7.01 Regulation FD Disclosure.
The Company will host a conference call to discuss its third quarter 2026 financial results on October 29, 2026, at 8:00 a.m. Eastern Time. The live webcast will be available in the Events & Presentations section of the Company’s Investor Relations website at ir.forbrightbank.com, in addition to the slide presentation for investor review. A copy of the slide presentation is furnished herewith as Exhibit 99.2 and is incorporated by reference herein.
A replay and transcript will be available in the Events & Presentations section of the Company’s Investor Relations website at ir.forbrightbank.com approximately two hours after the conclusion of the call.
Item 9.01 - Financial Statements and Exhibits.
(d) Exhibits:
Exhibit Number | Description | |||||||
99.1 | ||||||||
99.2 | ||||||||
104 | Cover Page Interactive Data File (embedded within the Inline XBRL document) | |||||||
SIGNATURE
Pursuant to the requirements of the Securities Exchange Act of 1934, as amended, the Registrant has duly caused this report to be signed on its behalf by the undersigned hereunto duly authorized.
FORBRIGHT, INC. | |||||||||||
Date: | October 29, 2026 | By: | /s/ Christopher S. Lynch | ||||||||
Name: | Christopher S. Lynch | ||||||||||
Title: | Chief Financial Officer | ||||||||||
Exhibit 99.1

Forbright, Inc. Reports Third Quarter 2026 Results
EPS of $0.41 on a fully diluted basis for the quarter
Net interest income up 14% QoQ
Loan balances up 9.5% QoQ and 24% YoY
Digital deposits grew by $1 billion QoQ driven by promotion
Core net charge-offs declined to 3 basis points in Q3
FOR IMMEDIATE RELEASE — CHEVY CHASE, MD, October 29, 2026
Fellow Shareholders,
Forbright, Inc.(1) (Nasdaq FRBT), the parent company of wholly-owned subsidiary Forbright Bank (the "Bank"), today reported financial results for the third quarter ended September 30, 2026.
Last quarter, we committed to writing to you plainly, so we will start with the headline: this was a strong quarter. The Company met or exceeded nearly every key performance metric we track relative to our expectations for the quarter. In addition, we believe the business is well-positioned for a strong finish to 2026 and a strong start to 2027.
Looking ahead, we believe our credit discipline, commitment to process and expense management, efficient digital funding platform, and focused lending strategies and fee businesses position the Company very well for long-term growth.
We will begin, as we should, with the numbers for this quarter:
•Net income attributable to the Company was $20.6 million, or $0.41 of diluted earnings attributable to the Company per outstanding share for this quarter.
•Loans grew 9.5% — from $6.1 billion last quarter to $6.6 billion this quarter.
•Net Interest Margin of 3.18% was roughly flat this quarter, compared to 3.19% last quarter.
•Credit quality was excellent. Loans on non-accrual were down, our average loan risk rating improved, and our core net charge-off rate was down to 3 basis points from 8 basis points in the prior quarter.
•Future growth is supported by $7.6 billion in deposits and $1.9 billion in cash and investments at quarter-end, excluding $744 million of deposits and $721 million of cash classified as held-for-sale.
While current conditions remain favorable, we endeavor to operate the business prudently and believe we are well-positioned to adapt to changing economic conditions.
| Quarter-over-Quarter | Year-over-Year | |||||||||||||
| n | Net interest income was $72.0 million for the three months ended September 30, 2026, an increase of $8.8 million from the three months ended June 30, 2026. | n | Net interest income was $194.7 million for the nine months ended September 30, 2026, a decrease of $1.3 million from the nine months ended September 30, 2025. | |||||||||||
(1) Forbright, Inc. is referred to as "Forbright," the "Company," "we," "our," or "us" throughout this press release.
1
| Quarter-over-Quarter | Year-over-Year | |||||||||||||
| n | Provision for credit losses was $1.5 million for the three months ended September 30, 2026, compared to $5.9 million for the three months ended June 30, 2026. Ratio of net charge-offs to average total loans at amortized cost was 0.08% for the three months ended September 30, 2026, compared to 0.20% for the three months ended June 30, 2026. | n | Provision for credit losses was $10.9 million for the nine months ended September 30, 2026, compared to $17.3 million for the nine months ended September 30, 2025. Ratio of net charge-offs to average total loans at amortized cost was 0.19% for the nine months ended September 30, 2026, compared to 0.23% for the nine months ended September 30, 2025. | |||||||||||
| n | Net interest margin was 3.18% for the three months ended September 30, 2026, a decrease of 1 basis point from the three months ended June 30, 2026. | n | Net interest margin was 3.16% for the nine months ended September 30, 2026, a decrease of 67 basis points from the nine months ended September 30, 2025. | |||||||||||
| n | Efficiency ratio was 69.65% for the three months ended September 30, 2026, compared to 77.39% for the three months ended June 30, 2026. | n | Efficiency ratio was 74.51% for the nine months ended September 30, 2026, compared to 61.29% for the nine months ended September 30, 2025. | |||||||||||
| n | Return on average stockholders' equity was 8.20% for the three months ended September 30, 2026, compared to 1.89% for the three months ended June 30, 2026. | n | Return on average stockholders' equity was 5.38% for the nine months ended September 30, 2026, compared to 10.31% for the nine months ended September 30, 2025. | |||||||||||
| n | Return on average tangible common equity(2) was 8.68% for the three months ended September 30, 2026, compared to 2.19% for the three months ended June 30, 2026. | n | Return on average tangible common equity(2) was 5.76% for the nine months ended September 30, 2026, compared to 10.91% for the nine months ended September 30, 2025. | |||||||||||
| n | Non-interest income was $29.1 million for the three months ended September 30, 2026, compared to $21.8 million for the three months ended June 30, 2026. | n | Non-interest income was $66.5 million for the nine months ended September 30, 2026, compared to $49.4 million for the nine months ended September 30, 2025. | |||||||||||
| n | Core non-interest income(2) was $17.1 million for the three months ended September 30, 2026, compared to $15.7 million for the three months ended June 30, 2026. | n | Core non-interest income(2) was $47.9 million for the nine months ended September 30, 2026, compared to $29.1 million for the nine months ended September 30, 2025. | |||||||||||
__________________
(2) Non-GAAP financial measure. See "Non-GAAP Financial Measures" section of this press release for a reconciliation to the most directly comparable GAAP measure.
BALANCE SHEET SUMMARY | ||
Total assets increased $1.1 billion to $9.6 billion as of September 30, 2026, from $8.5 billion as of June 30, 2026. On August 21, 2026, the Bank entered into an agreement to sell its Washington, D.C.-area legacy branches and associated deposits to Trustar Bank (the "Branch Sale"). The transaction will include branches in Potomac and North Bethesda, Maryland, a customer service hub in McLean, Virginia, and local deposits with a September 30, 2026 value of $744 million. We expect the Branch Sale to receive regulatory approval during the fourth quarter of 2026 and close during the first quarter of 2027. The increase in assets was primarily due to a build-up of cash, primarily recognized in assets held-for-sale, in anticipation of the Branch Sale and loan growth, partially offset by a decrease in investment securities.
Loans
Total loans were $6.6 billion as of September 30, 2026, an increase of $577.8 million from $6.1 billion as of June 30, 2026. The increase in loans was primarily due to new originations and balance increases in Healthcare Finance within Commercial Real Estate and Commercial and Industrial, and Lender Finance, Fund Finance, Asset Finance, and Project Finance within Commercial and Industrial loans held for investment.
Investment Securities
Total carrying amount of investment securities was $1.1 billion as of September 30, 2026, compared to $1.3 billion as of June 30, 2026. Investment securities decreased $0.2 billion due to maturities of U.S. Treasury securities.
2
Deposits
Total deposits were $7.6 billion as of September 30, 2026, compared to $7.3 billion as of June 30, 2026. The increase in deposits was primarily due to an increase in Digital Banking deposits driven by promotions during the quarter, partially offset by the reclassification of $743.9 million of deposits to held-for-sale liabilities in connection with the Branch Sale.
Borrowed Funds
Total borrowed funds were relatively flat at $151.3 million as of September 30, 2026, compared to $151.2 million as of June 30, 2026.
Stockholders' Equity
Total stockholders' equity was $991.7 million as of September 30, 2026, compared to $967.2 million as of June 30, 2026. The increase was primarily driven by the issuance of 1.0 million shares of common stock resulting in proceeds, net of issuance costs, of $17.1 million in connection with the overallotment option associated with the Company's initial public offering and net income for the quarter, partially offset by the impact of unrealized losses on investment securities available-for-sale in other comprehensive loss.
OUR VIEW | ||
This quarter demonstrates the strength of our business model and continued execution against our growth strategy.
Lending: Loan growth was 9.5% QoQ, driven by over $1 billion in originations. Growth was particularly strong in our Healthcare Finance strategy and each of our six lending businesses enters the fourth quarter with a strong pipeline. Spreads remain very competitive, and we continue to focus on conservative deal structures.
Fee Businesses: Our FHA/HUD strategy had a good quarter, including some catch-up from a slower second quarter. As noted last quarter, we expect results in this business to vary meaningfully QoQ. Our other fee businesses performed generally in line with plan. We have strategic and operational work to do to re-start growth in Alliance Partners, and that work began this past quarter. Higher long-term rates are expected to extend the duration of the servicing book in Solar Servicing.
One note on presentation in our fee businesses: Solar Servicing amounts are increased both in non-interest income and non-interest expense by reimbursable expenses of $7.2 million this quarter, with no impact on Forbright's earnings. As master servicer, we pass certain expenses (including legal expenses) through to the owners of the loans we service. That has always been the case, but extensive litigation in the residential solar sector has magnified the effect in a meaningful way.
Deposits and liquidity: As previewed in last quarter’s earnings presentation, the deposit promotion capability we launched in June exceeded expectations. We ended the quarter with $1.9 billion in cash and investments (excluding $721 million of cash held-for-sale associated with the pending Branch Sale transaction) which is 19.8% of assets. This liquidity position allowed us to hold our deposit rates steady following the Fed's September rate hike, which benefits net interest margin as approximately 85% of our loans repriced between the September rate hike and mid-October. We also have ample liquidity to fund the Branch Sale. Our digital deposit platform is designed to give us flexibility and control over our funding by raising deposits in times of strong loan growth and the ability to manage our cost of funds with discipline when we have excess liquidity.
Credit: Credit quality was excellent, and our average loan risk rating improved again this quarter. Forbright’s national, sector-focused commercial lending capabilities provide attractive financing solutions for our clients. At the same time, we manage credit risk by using our expertise and rigorous diligence to make critical and objective assessments of the risk in each loan we make.
Expenses and Efficiency: Our expense management efforts continue to pay off, and we are on track to meet or exceed our 2027 expense and efficiency objectives. Our efficiency ratio improved to 69.65% this quarter compared to the prior quarter. That number includes $7.2 million of Solar Servicing reimbursable expenses reflected as non-interest expense and non-interest income on our income statement. As we look to 2027, we expect operating expenses — excluding reimbursable expenses in our Solar Services business — will largely remain flat despite the projection for strong loan growth. This is due to the benefits of our fully built platform, a strong company-wide expense management culture, and efficiencies from AI adoption across the business.
3
Branch Sale to Trustar Bank: As noted, during the quarter, the Bank entered into an agreement to execute the Branch Sale to Trustar Bank. The transaction sharpens Forbright’s strategic focus on building a differentiated bank with three nationwide and complementary businesses: a scalable digital banking and deposit platform, a specialized middle-market commercial lending strategy, and fee-based advisory and servicing capabilities.
AI AND THE FUTURE OF DEPOSITS | ||
As previewed last quarter, we believe AI will accelerate the shift of deposits from branches to digital platforms. A good example of this is the recent launch of a personal AI assistant from a global social media company that quickly became one of the fastest-growing AI apps ever launched. It is an early indicator of a world where AI agents will allow consumers to shop for good savings rates; move money to attractive yield; and strip away the inertia that has long kept cheap and sticky consumer deposits in brick and mortar branches.
For banks, we believe an advantage will shift to institutions with attractive rates, the lowest-friction onboarding technology and an agent-ready platform. Forbright, Inc. Chairman and CEO, John Delaney recently co-wrote in the Wall Street Journal: this is "unambiguously good [for consumers]" but it also raises the bar for banks, and it is the shift Forbright is intently focused on.
Our Digital Banking team plans to roll out new AI capabilities in 2027 that are designed to allow Forbright customers to experience the benefits of AI without compromising financial security. For example, we plan to introduce a virtual card that customers can assign to their AI agents. This new feature is designed to help our customers keep their bank accounts private while securely making purchases through their AI agents. Our upcoming Virtual Card for AI agents is expected to allow users to set strict dollar limits and receive real-time updates, so people can have their AI agent order food delivery or make retail purchases without having to offer their banking history or debit cards. We also plan to give our customers the ability to provide their AI agents with permissioned, logged, and read-only access to Forbright data.
We view Forbright as well positioned for the AI-related changes coming to banking, and we intend to make sure it stays that way.
COMPARISONS | ||
Quarter-over-Quarter
Net Interest Income / Net Interest Margin
Net interest income was $72.0 million for the three months ended September 30, 2026, compared to $63.1 million for the three months ended June 30, 2026, an increase of $8.8 million. The change reflects an increase in interest income of $18.3 million compared to an increase in interest expense of $9.5 million.
Total interest income increased $18.3 million to $147.3 million for the three months ended September 30, 2026, from $129.1 million for the three months ended June 30, 2026. The increase was primarily due to growth in average loans which increased 9.5% compared to the prior quarter. The remaining increase was largely due to a 14 basis point increase in loan yields and the benefit of one additional day in the quarter. The increase in loan yields was largely due to a recovery of prior non-accrual interest.
Total interest expense increased $9.5 million to $75.4 million for the three months ended September 30, 2026, from $65.9 million for the three months ended June 30, 2026. The increase in interest expense was primarily due to an increase in Digital Banking deposits, an additional day in the quarter, and a one basis point increase in the cost of interest-bearing liabilities.
Net interest margin was 3.18% for the three months ended September 30, 2026, compared to 3.19% for the three months ended June 30, 2026, primarily due to an unfavorable change in asset mix associated with the build-up of excess liquidity in anticipation of the Branch Sale, and a three basis point increase in total cost of funds, which was offset by a 14 basis point increase in the yield on loans.
Provision for Credit Losses
The Company recorded a provision for credit losses of $1.5 million for the three months ended September 30, 2026 compared to a provision of $5.9 million for the three months ended June 30, 2026. The provision for credit losses for the quarter was driven by an increase in the allowance for credit losses on loans ("ACL – Loans") of
4
$1.2 million, net charge-offs of $1.2 million, and a decrease in the allowance for credit losses on unfunded commitments ("ACL – Unfunded") of $1.0 million. The provision for credit losses in the prior quarter was driven by an increase in the ACL – Loans of $1.8 million, net charge-offs of $2.7 million, and an increase in the ACL – Unfunded of $1.4 million. Net charge-offs for the quarterly periods that relate to legacy Consumer and Commercial and Industrial forward flow loans were $0.8 million and $1.7 million, respectively for the three months ended September 30, 2026 and June 30, 2026.
Non-interest Income
Total non-interest income was $29.1 million for the three months ended September 30, 2026, compared to $21.8 million for the three months ended June 30, 2026. The increase of $7.3 million was primarily due to realized and unrealized gains on loans, an increase in FHA/HUD originations, solar loan administration fees related to the solar servicing business, and one additional month of rental income from other tenants in our headquarters building, following our acquisition in April 2026.
Core non-interest income(2) was $17.1 million for the three months ended September 30, 2026, compared to $15.7 million for the three months ended June 30, 2026. The increase of $1.4 million was primarily due to the items noted for total non-interest income related to FHA/HUD fees and solar servicing income.
Non-interest Expense
Total non-interest expense was $70.4 million for the three months ended September 30, 2026 compared to $65.8 million for the three months ended June 30, 2026. The increase of $4.6 million was primarily due to the combination of (i) an increase in incentive bonus compensation, (ii) legal and sub-servicer fees related to the Solar Servicing business, which are largely reimbursed by counterparties to the loans and recognized in other non-interest income and other corporate legal fees, and (iii) one additional month of expenses related to the ownership of the Company’s headquarters following the building acquisition in April 2026. Those increases were partially offset by a decrease in advertising expense related to Digital Banking deposit promotions.
Income Taxes
Income tax expense was $8.5 million for the three months ended September 30, 2026, resulting in an effective tax rate of 29.0%, compared to income tax expense of $9.2 million and an effective tax rate of 69.0% for the three months ended June 30, 2026. Income tax expense for the three months ended September 30, 2026, reflects the recognition of $2.7 million of deferred credit amortization that was offset by a purchase accounting adjustment of $2.7 million for previously recognized amortization, resulting in no net impact from the deferred credit in the quarter. The purchase accounting adjustment was related to the completion of the final tax return for the acquired entity.
Income tax expense for the three months ended June 30, 2026, included (i) a $5.6 million write-down of deferred tax assets as of December 31, 2025, for stock compensation in connection with the initial public offering, which is due to tax rules that limit executive compensation deductions for public companies, and (ii) a $1.1 million benefit for amortization of the deferred credit.
For the three months ended June 30, 2026, the effective tax rate was increased by 42.3% related to the one-time deferred tax asset adjustment for stock compensation, offset by a reduction of 8.6% related to amortization of the deferred credit.
The deferred credit balance as of September 30, 2026, was $36.0 million, compared to $49.1 million as of June 30, 2026. The decrease of $13.1 million was due to true-up adjustments resulting from the final tax return for the acquired entity.
__________________
(2) Non-GAAP financial measure. See "Non-GAAP Financial Measures" section of this press release for a reconciliation to the most directly comparable GAAP measure.
Year-over-Year
Net Interest Income / Net Interest Margin
Net interest income was $194.7 million for the nine months ended September 30, 2026, compared to $196.0 million for the nine months ended September 30, 2025. The slight decrease of $1.3 million was primarily due to an increase in interest expense of $17.5 million marginally exceeding an increase in interest income of $16.2 million.
5
Total interest income increased $16.2 million to $400.2 million for the nine months ended September 30, 2026, from $384.0 million for the nine months ended September 30, 2025. The increase was primarily due to increases in average loan balances and interest-earning deposits with banks, largely offset by a 142 basis point decrease in yield earned on loans, as well as lower average balances and yields on investment securities. The 142 basis point decrease in yield earned on loans was primarily driven by a 68 basis point decrease in average SOFR, lower average spreads reflecting changes in market pricing, and a mix shift in the loan portfolio toward lower-yielding categories, and higher relative levels of amortization of deferred fees during the nine months ended September 30, 2025, which included $9.8 million for restructured loans.
Total interest expense increased $17.5 million to $205.5 million for the nine months ended September 30, 2026, from $188.0 million for the nine months ended September 30, 2025. The increase in interest expense was primarily due to an increase in average balances in Digital Banking deposits and third-party sweep deposits largely offset by a 35 basis point decrease in the average rate paid on interest-bearing deposits.
Net interest margin was 3.16% for the nine months ended September 30, 2026, compared to 3.83% for the nine months ended September 30, 2025, primarily due to a 142 basis point decrease in the yield on loans partially offset by a positive change in asset mix with loan growth exceeding growth in other earning asset categories, and a 39 basis point decrease in total cost of funds.
Provision for Credit Losses
The Company recorded a provision for credit losses of $10.9 million for the nine months ended September 30, 2026, compared to $17.3 million for the nine months ended September 30, 2025. The provision for credit losses for the nine months ended September 30, 2026, was driven by an increase in the ACL – Loans of $2.8 million and net charge-offs of $8.0 million. The provision for credit losses for the nine months ended September 30, 2025, was driven by an increase in the ACL – Loans of $9.1 million, $7.5 million in net charge-offs, and an increase of $0.6 million in the ACL – Unfunded. Net charge-offs for the year-to-date periods that relate to legacy Consumer and Commercial and Industrial forward flow loans were $5.6 million and $7.4 million, respectively for the nine months ended September 30, 2026 and 2025.
Non-interest Income
Total non-interest income was $66.5 million for the nine months ended September 30, 2026, compared to $49.4 million for the nine months ended September 30, 2025. The increase of $17.1 million was primarily due to servicing fees and trust administration income related to the solar servicing business. The increase was offset by less gains on loan sales and fair value marks, lower investment advisory fees, and a decrease in income related to lower volume of FHA/HUD originations.
Core non-interest income(2) was $47.9 million for the nine months ended September 30, 2026, compared to $29.1 million for the nine months ended September 30, 2025. The increase of $18.8 million was primarily due to the items noted for total non-interest income related to solar servicing income, partially offset by lower investment advisory fees and lower FHA/HUD originations.
Non-interest Expense
Total non-interest expense was $194.6 million for the nine months ended September 30, 2026, compared to $150.4 million for the nine months ended September 30, 2025. The increase of $44.2 million was primarily due to (i) the acquisition of the Solar Servicing business, (ii) the personnel retention compensation program implemented in connection with our initial public offering, (iii) professional fees associated with the initial public offering, and (iv) expenses related to the ownership of the Company’s headquarters following the building acquisition in April 2026.
Income Taxes
Income tax expense was $19.2 million for the nine months ended September 30, 2026, resulting in an effective tax rate of 34.5%, compared to income tax expense of $19.3 million and an effective tax rate of 24.9% for the nine months ended September 30, 2025. Income tax expense for the nine months ended September 30, 2026, included (i) a $5.6 million write-down of deferred tax assets as of December 31, 2025, for stock compensation in connection with the initial public offering, which is due to tax rules that limit executive compensation deductions for companies with publicly traded securities, and (ii) a $5.5 million benefit for amortization of the deferred credit, partially offset by the effect of the $2.7 million purchase accounting adjustment recorded in the third quarter.
For the nine months ended September 30, 2026, the effective tax rate was (i) increased by 10.1% for the one-time deferred tax asset adjustment for stock compensation in the second quarter, (ii) increased by 4.8% for the
6
purchase accounting adjustment in the third quarter, and (iii) reduced by 9.9% for amortization of the deferred credit.
__________________
(2) Non-GAAP financial measure. See "Non-GAAP Financial Measures" section of this press release for a reconciliation to the most directly comparable GAAP measure.
ASSET QUALITY | ||
The Company's ACL – Loans held for investment at amortized cost was $55.8 million, or 0.91% of total loans held for investment at amortized cost, as of September 30, 2026, compared to $54.6 million, or 0.98%, as of June 30, 2026. The increase in the allowance for September 30, 2026 compared to June 30, 2026, was primarily due to loan growth during the quarter while the reduction in the ratio of ACL – Loans to total loans held for investment at amortized cost was primarily driven by a mix shift within the portfolio toward portfolios with lower ACL – Loans to loans held for investment at amortized cost ratios.
Net charge-offs were $1.2 million, or 0.08% of average loans held for investment at amortized cost, for the three months ended September 30, 2026, compared to $2.7 million, or 0.20%, for the three months ended June 30, 2026. Of the net charge-offs for the three months ended September 30, 2026 and June 30, 2026, $0.8 million and $1.7 million were related to legacy Consumer and Commercial and Industrial forward flow loans.
Net charge-offs were $8.0 million, or 0.19% of average loans held for investment at amortized cost, for the nine months ended September 30, 2026, compared to $7.5 million, or 0.23%, for the nine months ended September 30, 2025. Of the net charge-offs for the nine months ended September 30, 2026 and September 30, 2025, $5.6 million and $7.4 million were related to legacy Consumer and Commercial and Industrial forward flow loans.
Non-performing assets were $74.9 million as of September 30, 2026, compared to $93.7 million as of June 30, 2026. Non-performing assets as a percentage of total assets were 0.78% as of September 30, 2026, compared to 1.10% as of June 30, 2026. Both in total, and as a percentage of total assets, non-performing assets declined from June 30, 2026 to September 30, 2026. The decrease was primarily due to the pay-off or return to accrual status of Commercial Real Estate loans in Healthcare Finance and Real Estate Finance, and Commercial and Industrial loans in Corporate Finance. The decrease in total non-accrual loans was partially offset by the transfer of one Commercial Real Estate asset from loans held for investment at amortized cost to other real estate owned assets.
Non-performing loans held for investment at amortized cost were $56.2 million as of September 30, 2026, compared to $72.5 million as of June 30, 2026. Non-performing loans as a percentage of total loans held for investment at amortized cost was 0.91% as of September 30, 2026, compared to 1.30% as of June 30, 2026. Non-performing loans held for investment at amortized cost declined from June 30, 2026 to September 30, 2026. The decrease was primarily due to the pay-off or return to accrual status of Commercial Real Estate loans in Healthcare Finance and Real Estate Finance during the quarter.
CAPITAL | ||
As of September 30, 2026, the Company’s and Bank’s Tier 1 leverage ratio were 9.80% and 10.41%, respectively, compared to 10.38% and 11.24%, respectively, as of June 30, 2026.
As of September 30, 2026, the Company’s and Bank’s Common Equity Tier 1 ratio were 12.87% and 13.68%, respectively, compared to 12.97% and 14.08%, respectively, as of June 30, 2026.
Total stockholders' equity was $991.7 million as of September 30, 2026, compared to $967.2 million as of June 30, 2026. The increase was primarily driven by the issuance of 1.0 million shares of common stock resulting in proceeds, net of issuance costs, of $17.1 million in connection with the overallotment option associated with the Company's initial public offering and net income for the quarter, partially offset by the impact of unrealized losses on investment securities available-for-sale in other comprehensive loss.
As of September 30, 2026, the Company had:
•available borrowing capacity of $422.2 million with the Federal Home Loan Bank of Atlanta;
•available borrowing capacity of $2.1 billion with the Federal Reserve Bank;
7
•available borrowing capacity of $110.0 million from Fed Funds facilities with four other financial institutions; and
•available-for-sale investment securities with a fair value of $1.0 billion.
CONFERENCE CALL AND WEBCAST | ||
The Company will host a conference call to discuss its third quarter 2026 financial results on October 29, 2026, at 8:00 a.m. Eastern Time. The live webcast will be available in the Events & Presentations section of the Company’s Investor Relations website at ir.forbrightbank.com.
To join by phone, please pre-register here at least 15 minutes before the call begins.
A replay and transcript will be available in the Events & Presentations section of the Company’s Investor Relations website at ir.forbrightbank.com approximately two hours after the conclusion of the call.
ABOUT FORBRIGHT, INC. | ||
Forbright, Inc. (Nasdaq: FRBT) is a financial holding company and the parent of FDIC-insured Forbright Bank, a modern financial services platform spanning nationwide middle-market lending, digital consumer banking, strategic advisory, and asset management services. Headquartered in Chevy Chase, Maryland, the Company operates at the intersection of two powerful, structural forces reshaping the U.S. banking sector: the rapidly evolving needs of the $10 trillion national middle market and the broadly accelerating shift toward digital-first banking. For more information, please visit forbrightbank.com. The information contained in, or that can be accessed through, our website is not incorporated by reference in, and is not part of, this press release. The inclusion of our website address in this press release is only as an inactive textual reference.
FORWARD-LOOKING STATEMENTS | ||
This press release contains forward-looking statements within the meaning of the Private Securities Litigation Reform Act of 1995. These forward-looking statements include discussion of plans, estimates, objectives, goals, guidelines, expectations, intentions, projections and statements of our beliefs concerning future events, business plans, objectives, expected operating results and the assumptions upon which those statements are based. Forward-looking statements include, without limitation, any statement that may predict, forecast, indicate or imply future results, performance or achievements, and are typically identified with words such as "see," “may,” “could,” “should,” “will,” “would,” “believe,” “anticipate,” “estimate,” “expect,” “aim,” “intend,” “plan” or words or phrases of similar meaning. We caution that the forward-looking statements are based largely on our expectations and are subject to a number of known and unknown risks and uncertainties that are subject to change based on factors which are, in many instances, beyond our control. Such forward-looking statements are based on various assumptions (some of which may be beyond our control) and are subject to risks and uncertainties, which change over time, and other factors which could cause actual results to differ materially from those currently anticipated. Such risks and uncertainties include, but are not limited to: economic conditions that impact the financial services industry and/or our business; our ability to manage our credit risk effectively and the potential deterioration of the business and economic conditions in our primary market areas; the composition of our loan portfolio; our ability to achieve organic loan and deposit growth and the composition of such growth; our ability to maintain our bank’s reputation; our ability to attract and retain skilled employees and manage changes in our management personnel; risks associated with unauthorized access, cyber-crime and other threats to data security; our ability to effectively compete with other financial services companies and the effects of competition in the financial services industry on our business; our ability to successfully develop and commercialize new or enhanced products and services; changes in the demand for our products and services; the sufficiency of our capital, including sources of capital and the extent to which we may be required to raise additional capital to meet our goals; the effectiveness of our risk management and internal disclosure controls and procedures; our access to sources of liquidity and capital to address our liquidity needs; the effects of the failure of any component of our business infrastructure provided by a third-party; any failure or interruption of our information and communications systems; the impact of, and changes in applicable laws, regulations and accounting standards and policies; the effects of geopolitical instability, including war, terrorist attacks, and man-made and natural disasters; our ability to keep pace with technological changes; the effects of problems encountered by other financial institutions; the ability to adapt to rapid technological changes, including advancements related to artificial intelligence ("AI"), the use of AI models in credit decisioning, customer service, and operations, including risks of model error, bias, regulatory scrutiny under fair lending laws, and third-party AI dependencies, digital banking platforms, and cybersecurity; advances and changes in technology, including AI, and the Company's ability to develop timely and competitive products and services and effectively manage related risks; risks related to our implementation of new lines of business, new products and services, new technologies, and expansion of our existing business opportunities; risks related to the development and use of AI; and other risks and uncertainties described under “Risk Factors” of our Quarterly Report on Form 10-Q for the quarterly period ended June 30, 2026, and subsequent filings with the U.S. Securities and Exchange Commission.
8
All such factors are difficult to predict, contain uncertainties that may materially affect actual results and may be beyond our control. New factors emerge from time to time, and it is not possible for management to predict all such factors or to assess the impact of each such factor on the Company. Any forward-looking statement speaks only as of the date on which such statement is made, and we do not undertake any obligation to update any forward-looking statement to reflect events or circumstances after the date on which such statement is made except as required by the federal securities laws.
If one or more of these or other risks or uncertainties materialize, or if our underlying assumptions prove to be incorrect, our actual results may vary materially from what we may have expressed or implied by these forward-looking statements. We caution that you should not place undue reliance on any of our forward-looking statements. Furthermore, new risks and uncertainties arise from time to time, and it is impossible for us to predict those events or how they may affect us.
INVESTOR & MEDIA CONTACT: Ben Wakana, Chief Public Affairs and Investor Relations Officer | 207-551-7415 | bwakana@forbrightbank.com
9
FINANCIAL TABLES | ||
FORBRIGHT, INC. AND SUBSIDIARIES
Consolidated Statements of Income
(Unaudited)
| For the Three Months Ended | ||||||||||||||||||||||||||||||||
| (dollars in thousands, except per share amounts) | September 30, 2026 | June 30, 2026 | March 31, 2026 | December 31, 2025 | September 30, 2025 | |||||||||||||||||||||||||||
| INTEREST INCOME | ||||||||||||||||||||||||||||||||
| Loans held for investment | $ | 110,628 | $ | 98,522 | $ | 93,164 | $ | 101,360 | $ | 107,825 | ||||||||||||||||||||||
| Loans held-for-sale | 10,016 | 8,484 | 8,194 | 9,760 | 8,452 | |||||||||||||||||||||||||||
| Deposits with banks | 12,991 | 7,252 | 7,582 | 6,419 | 7,606 | |||||||||||||||||||||||||||
| Interest on investment securities | 13,052 | 14,158 | 14,099 | 14,364 | 15,098 | |||||||||||||||||||||||||||
| Interest and dividends on other earning assets | 651 | 648 | 716 | 774 | 788 | |||||||||||||||||||||||||||
| Total interest income | 147,338 | 129,064 | 123,755 | 132,677 | 139,769 | |||||||||||||||||||||||||||
| INTEREST EXPENSE | ||||||||||||||||||||||||||||||||
| Deposits | 73,477 | 64,024 | 62,295 | 63,695 | 64,503 | |||||||||||||||||||||||||||
| Subordinated debt, net | 1,909 | 1,895 | 1,902 | 1,929 | 1,951 | |||||||||||||||||||||||||||
| Other borrowings | — | — | — | 11 | 122 | |||||||||||||||||||||||||||
| Total interest expense | 75,386 | 65,919 | 64,197 | 65,635 | 66,576 | |||||||||||||||||||||||||||
| Net interest income | 71,952 | 63,145 | 59,558 | 67,042 | 73,193 | |||||||||||||||||||||||||||
| Provision for credit losses | 1,499 | 5,899 | 3,473 | 6,700 | 4,762 | |||||||||||||||||||||||||||
| Net interest income after provision for credit losses | 70,453 | 57,246 | 56,085 | 60,342 | 68,431 | |||||||||||||||||||||||||||
| NON-INTEREST INCOME | ||||||||||||||||||||||||||||||||
| Servicing income | 6,592 | 6,876 | 7,087 | 7,385 | 805 | |||||||||||||||||||||||||||
| Investment advisory fees | 3,194 | 3,090 | 3,193 | 3,775 | 3,917 | |||||||||||||||||||||||||||
| Fee income on loans | 2,116 | 2,252 | 2,003 | 2,530 | 2,006 | |||||||||||||||||||||||||||
| Gains/(losses) on sales of loans and investment securities, net | 1,946 | 252 | (34) | (281) | 10,690 | |||||||||||||||||||||||||||
| Unrealized gains/(losses) on loans and financing receivables, net | 1,263 | (963) | (1,335) | (615) | 4,443 | |||||||||||||||||||||||||||
| Other non-interest income | 13,989 | 10,339 | 4,670 | 8,554 | 2,275 | |||||||||||||||||||||||||||
| Total non-interest income | 29,100 | 21,846 | 15,584 | 21,348 | 24,136 | |||||||||||||||||||||||||||
| NON-INTEREST EXPENSE | ||||||||||||||||||||||||||||||||
| Compensation and benefits | 36,422 | 33,407 | 31,642 | 33,417 | 33,255 | |||||||||||||||||||||||||||
| Information technology | 7,705 | 7,581 | 7,540 | 7,449 | 6,573 | |||||||||||||||||||||||||||
| Professional fees | 11,422 | 9,777 | 7,823 | 6,127 | 3,222 | |||||||||||||||||||||||||||
| Loan administration and servicing | 6,917 | 5,500 | 4,125 | 4,376 | 1,363 | |||||||||||||||||||||||||||
| Advertising and marketing | 1,688 | 2,720 | 2,304 | 931 | 774 | |||||||||||||||||||||||||||
| FDIC insurance | 1,033 | 1,111 | 902 | 866 | 817 | |||||||||||||||||||||||||||
| Occupancy expense | 1,812 | 1,466 | 1,122 | 1,111 | 1,079 | |||||||||||||||||||||||||||
| Other non-interest expense | 3,381 | 4,214 | 2,999 | 3,930 | 3,419 | |||||||||||||||||||||||||||
| Total non-interest expense | 70,380 | 65,776 | 58,457 | 58,207 | 50,502 | |||||||||||||||||||||||||||
| Income before income taxes | 29,173 | 13,316 | 13,212 | 23,483 | 42,065 | |||||||||||||||||||||||||||
| Income tax expense/(benefit) | 8,465 | 9,194 | 1,580 | (6,111) | 9,969 | |||||||||||||||||||||||||||
| Net income | 20,708 | 4,122 | 11,632 | 29,594 | 32,096 | |||||||||||||||||||||||||||
Net income attributable to noncontrolling interest | 85 | — | — | — | — | |||||||||||||||||||||||||||
Net income attributable to the Company | $ | 20,623 | $ | 4,122 | $ | 11,632 | $ | 29,594 | $ | 32,096 | ||||||||||||||||||||||
10
FORBRIGHT, INC. AND SUBSIDIARIES
Consolidated Statements of Income - Metrics
(Unaudited)
| For the Three Months Ended | ||||||||||||||||||||||||||||||||
| (dollars in thousands, except per share amounts) | September 30, 2026 | June 30, 2026 | March 31, 2026 | December 31, 2025 | September 30, 2025 | |||||||||||||||||||||||||||
| PER SHARE DATA | ||||||||||||||||||||||||||||||||
| Basic earnings attributable to the Company per voting and non-voting common share | $ | 0.42 | $ | 0.10 | $ | 0.29 | $ | 0.73 | $ | 0.80 | ||||||||||||||||||||||
| Diluted earnings attributable to the Company per voting and non-voting common share | $ | 0.41 | $ | 0.09 | $ | 0.27 | $ | 0.72 | $ | 0.78 | ||||||||||||||||||||||
| Weighted-average shares used to compute earnings attributable to the Company per voting common share: | ||||||||||||||||||||||||||||||||
| Basic | 30,048,936 | 21,175,037 | 19,063,817 | 19,032,287 | 19,029,795 | |||||||||||||||||||||||||||
| Diluted | 31,806,389 | 23,498,322 | 21,188,692 | 20,066,576 | 20,039,544 | |||||||||||||||||||||||||||
| Weighted-average shares used to compute earnings attributable to the Company per non-voting common share, basic and diluted | 19,100,718 | 21,014,378 | 21,242,551 | 21,242,551 | 21,242,551 | |||||||||||||||||||||||||||
| Stockholders’ equity per total common share outstanding | $ | 19.54 | $ | 19.46 | $ | 20.35 | $ | 20.22 | $ | 19.43 | ||||||||||||||||||||||
Tangible book value per total common share outstanding (Non-GAAP)(1) | $ | 18.84 | $ | 18.74 | $ | 19.58 | $ | 19.44 | $ | 18.64 | ||||||||||||||||||||||
| CAPITAL RATIOS | ||||||||||||||||||||||||||||||||
| Company: | ||||||||||||||||||||||||||||||||
Tier 1 leverage ratio(2) | 9.80 | % | 10.38 | % | 8.92 | % | 9.79 | % | 8.82 | % | ||||||||||||||||||||||
Common Equity Tier 1 to risk weighted-assets ratio(2) | 12.87 | % | 12.97 | % | 11.47 | % | 12.72 | % | 10.15 | % | ||||||||||||||||||||||
| PERFORMANCE RATIOS | ||||||||||||||||||||||||||||||||
Return on average total assets(3) | 0.89 | % | 0.20 | % | 0.59 | % | 1.52 | % | 1.72 | % | ||||||||||||||||||||||
Return on average stockholders’ equity(3) | 8.20 | % | 1.89 | % | 5.62 | % | 14.52 | % | 16.46 | % | ||||||||||||||||||||||
Return on average tangible common equity(1), (3) | 8.68 | % | 2.19 | % | 5.95 | % | 15.25 | % | 17.32 | % | ||||||||||||||||||||||
Yield on earning assets(3) | 6.51 | % | 6.52 | % | 6.44 | % | 7.03 | % | 7.71 | % | ||||||||||||||||||||||
Yield on interest-bearing liabilities(3) | 3.88 | % | 3.87 | % | 3.89 | % | 4.05 | % | 4.24 | % | ||||||||||||||||||||||
Spread(4) | 2.63 | % | 2.65 | % | 2.55 | % | 2.98 | % | 3.47 | % | ||||||||||||||||||||||
Net interest margin(5) | 3.18 | % | 3.19 | % | 3.10 | % | 3.55 | % | 4.04 | % | ||||||||||||||||||||||
Efficiency ratio(6) | 69.65 | % | 77.39 | % | 77.80 | % | 65.85 | % | 51.89 | % | ||||||||||||||||||||||
CREDIT QUALITY RATIOS | ||||||||||||||||||||||||||||||||
Non-performing assets to total assets | 0.78 | % | 1.10 | % | 1.14 | % | 1.06 | % | 0.55 | % | ||||||||||||||||||||||
| Non-performing loans to total loans held for investment at amortized cost | 0.91 | % | 1.30 | % | 1.38 | % | 1.30 | % | 0.60 | % | ||||||||||||||||||||||
| ACL - Loans to total loans at amortized cost at period end | 0.91 | % | 0.98 | % | 0.98 | % | 1.01 | % | 1.03 | % | ||||||||||||||||||||||
Net loan charge-offs to average total loans held for investment at amortized cost(3) | (0.08) | % | (0.20) | % | (0.32) | % | (0.41) | % | (0.16) | % | ||||||||||||||||||||||
__________________
(1)Non-GAAP financial measure. See "Non-GAAP Financial Measures" section of this press release for a reconciliation to the most directly comparable GAAP measure.
(2)Regulatory capital ratios as of September 30, 2026 are preliminary pending filing of regulatory reports.
(3)Annualized.
(4)Spread represents the difference between the annualized weighted average yield on interest-earning assets and the annualized weighted average rate paid on interest-bearing liabilities.
(5)Net interest margin is computed by dividing annualized net interest income by total average interest-earning assets.
(6)Efficiency ratio is calculated by dividing non-interest expense by total revenue, which equals the sum of net interest income and non-interest income.
11
FORBRIGHT, INC. AND SUBSIDIARIES
Consolidated Balance Sheets
(Unaudited)
| (dollars in thousands) | September 30, 2026 | June 30, 2026 | March 31, 2026 | December 31, 2025 | September 30, 2025 | |||||||||||||||||||||||||||
| ASSETS | ||||||||||||||||||||||||||||||||
| Cash, due from banks and restricted cash | $ | 37,685 | $ | 26,524 | $ | 25,280 | $ | 18,241 | $ | 20,261 | ||||||||||||||||||||||
| Interest-bearing deposits with banks | 811,274 | 808,192 | 840,856 | 630,474 | 609,955 | |||||||||||||||||||||||||||
| Cash, cash equivalents and restricted cash | 848,959 | 834,716 | 866,136 | 648,715 | 630,216 | |||||||||||||||||||||||||||
| Investment securities available-for-sale, at fair value | 1,014,605 | 1,210,665 | 1,235,599 | 1,254,887 | 1,257,175 | |||||||||||||||||||||||||||
Investment securities held-to-maturity, at amortized cost(1) | 48,489 | 48,634 | 48,834 | 48,834 | 52,081 | |||||||||||||||||||||||||||
| Loans held-for-sale | 476,036 | 465,474 | 407,594 | 379,662 | 370,512 | |||||||||||||||||||||||||||
| Loans held for investment, at fair value | 2,855 | 3,481 | 4,555 | 4,645 | 5,105 | |||||||||||||||||||||||||||
| Loans held for investment, at amortized cost | 6,163,716 | 5,595,872 | 5,376,537 | 5,222,234 | 4,987,894 | |||||||||||||||||||||||||||
| Allowance for credit losses - loans | (55,833) | (54,621) | (52,794) | (52,986) | (51,430) | |||||||||||||||||||||||||||
| Net loans held for investment, at amortized cost | 6,107,883 | 5,541,251 | 5,323,743 | 5,169,248 | 4,936,464 | |||||||||||||||||||||||||||
| Other earning assets, net | 50,470 | 50,479 | 50,690 | 55,928 | 56,014 | |||||||||||||||||||||||||||
| Deferred tax asset, net | 138,276 | 145,269 | 152,963 | 153,314 | 178,205 | |||||||||||||||||||||||||||
| Accrued interest receivable | 49,071 | 46,445 | 45,369 | 55,155 | 49,037 | |||||||||||||||||||||||||||
| Premises and equipment, net | 41,990 | 47,877 | 29,763 | 30,763 | 31,952 | |||||||||||||||||||||||||||
| Goodwill and other intangible assets, net | 35,452 | 35,964 | 31,402 | 31,685 | 32,026 | |||||||||||||||||||||||||||
| Other assets | 83,427 | 75,249 | 36,412 | 56,470 | 89,790 | |||||||||||||||||||||||||||
| Assets held-for-sale | 726,837 | — | — | — | — | |||||||||||||||||||||||||||
Total assets | $ | 9,624,350 | $ | 8,505,504 | $ | 8,233,060 | $ | 7,889,306 | $ | 7,688,577 | ||||||||||||||||||||||
| LIABILITIES | ||||||||||||||||||||||||||||||||
| Non-interest-bearing deposits | $ | 362,080 | $ | 435,065 | $ | 473,153 | $ | 372,444 | $ | 355,684 | ||||||||||||||||||||||
| Interest-bearing deposits | 7,248,590 | 6,830,770 | 6,665,055 | 6,405,471 | 6,145,833 | |||||||||||||||||||||||||||
| Total deposits | 7,610,670 | 7,265,835 | 7,138,208 | 6,777,915 | 6,501,517 | |||||||||||||||||||||||||||
| Subordinated debt, net | 151,270 | 151,181 | 151,092 | 151,003 | 150,914 | |||||||||||||||||||||||||||
| Other borrowings | — | — | — | — | 90,000 | |||||||||||||||||||||||||||
| Total borrowed funds | 151,270 | 151,181 | 151,092 | 151,003 | 240,914 | |||||||||||||||||||||||||||
| Other liabilities | 118,641 | 121,325 | 112,565 | 137,945 | 156,373 | |||||||||||||||||||||||||||
| Liabilities held-for-sale | 749,135 | — | — | — | — | |||||||||||||||||||||||||||
| Total liabilities | 8,629,716 | 7,538,341 | 7,401,865 | 7,066,863 | 6,898,804 | |||||||||||||||||||||||||||
| Off-balance sheet commitments | ||||||||||||||||||||||||||||||||
| Redeemable noncontrolling interest | 2,885 | — | — | — | — | |||||||||||||||||||||||||||
| STOCKHOLDERS’ EQUITY | ||||||||||||||||||||||||||||||||
| Preferred stock | — | — | — | — | — | |||||||||||||||||||||||||||
| Common stock: | ||||||||||||||||||||||||||||||||
| Voting common stock | 33 | 29 | 20 | 20 | 20 | |||||||||||||||||||||||||||
| Non-voting common stock | 18 | 21 | 21 | 21 | 21 | |||||||||||||||||||||||||||
| Additional paid-in capital | 650,070 | 628,499 | 493,074 | 490,550 | 488,320 | |||||||||||||||||||||||||||
| Retained earnings | 365,205 | 344,582 | 340,460 | 328,828 | 299,234 | |||||||||||||||||||||||||||
| Accumulated other comprehensive (loss)/income | (23,577) | (5,968) | (2,380) | 3,024 | 2,178 | |||||||||||||||||||||||||||
| Total stockholders’ equity | 991,749 | 967,163 | 831,195 | 822,443 | 789,773 | |||||||||||||||||||||||||||
| Total liabilities, redeemable noncontrolling interest, and stockholders’ equity | $ | 9,624,350 | $ | 8,505,504 | $ | 8,233,060 | $ | 7,889,306 | $ | 7,688,577 | ||||||||||||||||||||||
__________________
(1)Net of allowance for credit losses - investment securities of $110 as of September 30, 2026, June 30, 2026, March 31, 2026, and December 31, 2025, and $161 as of September 30, 2025.
12
FORBRIGHT, INC. AND SUBSIDIARIES
Consolidated Statements of Income
(Unaudited)
| For the Nine Months Ended | ||||||||||||||
| (dollars in thousands, except per share amounts) | September 30, 2026 | September 30, 2025 | ||||||||||||
| INTEREST INCOME | ||||||||||||||
| Loans held for investment | $ | 302,314 | $ | 283,584 | ||||||||||
| Loans held-for-sale | 26,694 | 28,274 | ||||||||||||
| Deposits with banks | 27,825 | 22,182 | ||||||||||||
| Interest on investment securities | 41,309 | 47,359 | ||||||||||||
| Interest and dividends on other earning assets | 2,015 | 2,564 | ||||||||||||
| Total interest income | 400,157 | 383,963 | ||||||||||||
| INTEREST EXPENSE | ||||||||||||||
| Deposits | 199,796 | 179,708 | ||||||||||||
| Subordinated debt, net | 5,706 | 6,893 | ||||||||||||
| Other borrowings | — | 1,388 | ||||||||||||
| Total interest expense | 205,502 | 187,989 | ||||||||||||
| Net interest income | 194,655 | 195,974 | ||||||||||||
| Provision for credit losses | 10,871 | 17,311 | ||||||||||||
| Net interest income after provision for credit losses | 183,784 | 178,663 | ||||||||||||
| NON-INTEREST INCOME | ||||||||||||||
| Servicing income | 20,555 | 805 | ||||||||||||
| Investment advisory fees | 9,477 | 12,415 | ||||||||||||
| Fee income on loans | 6,371 | 5,837 | ||||||||||||
| Gains on sales of loans and investment securities, net | 2,164 | 12,860 | ||||||||||||
| Unrealized (losses)/gains on loans and financing receivables, net | (1,035) | 7,189 | ||||||||||||
| Other non-interest income | 28,998 | 10,322 | ||||||||||||
| Total non-interest income | 66,530 | 49,428 | ||||||||||||
| NON-INTEREST EXPENSE | ||||||||||||||
| Compensation and benefits | 101,471 | 93,695 | ||||||||||||
| Information technology | 22,826 | 19,469 | ||||||||||||
| Professional fees | 29,022 | 9,764 | ||||||||||||
| Loan administration and servicing | 16,542 | 4,119 | ||||||||||||
| Advertising and marketing | 6,712 | 5,313 | ||||||||||||
| FDIC insurance | 3,046 | 4,166 | ||||||||||||
| Occupancy expense | 4,400 | 3,576 | ||||||||||||
| Other non-interest expense | 10,594 | 10,315 | ||||||||||||
| Total non-interest expense | 194,613 | 150,417 | ||||||||||||
| Income before income taxes | 55,701 | 77,674 | ||||||||||||
| Income tax expense | 19,239 | 19,342 | ||||||||||||
| Net income | 36,462 | 58,332 | ||||||||||||
Net income attributable to noncontrolling interest | 85 | — | ||||||||||||
Net income attributable to the Company | $ | 36,377 | $ | 58,332 | ||||||||||
13
FORBRIGHT, INC. AND SUBSIDIARIES
Consolidated Statements of Income - Metrics
(Unaudited)
| For the Nine Months Ended | ||||||||||||||
| (dollars in thousands, except per share amounts) | September 30, 2026 | September 30, 2025 | ||||||||||||
| PER SHARE DATA | ||||||||||||||
| Basic earnings attributable to the Company per voting common share | $ | 0.86 | $ | 1.45 | ||||||||||
| Basic earnings attributable to the Company per non-voting common share | $ | 0.79 | $ | 1.45 | ||||||||||
| Diluted earnings attributable to the Company per voting common share | $ | 0.83 | $ | 1.41 | ||||||||||
| Diluted earnings attributable to the Company per non-voting common share | $ | 0.76 | $ | 1.41 | ||||||||||
| Weighted-average shares used to compute earnings attributable to the Company per voting common share: | ||||||||||||||
| Basic | 23,466,079 | 19,004,185 | ||||||||||||
| Diluted | 25,066,853 | 20,116,479 | ||||||||||||
| Weighted-average shares used to compute earnings attributable to the Company per non-voting common share, basic and diluted | 20,444,703 | 21,242,551 | ||||||||||||
| PERFORMANCE RATIOS | ||||||||||||||
Return on average total assets(1) | 0.57 | % | 1.11 | % | ||||||||||
Return on average stockholders’ equity(1) | 5.38 | % | 10.31 | % | ||||||||||
Return on average tangible common equity(1), (2) | 5.76 | % | 10.91 | % | ||||||||||
Yield on earning assets(1) | 6.49 | % | 7.51 | % | ||||||||||
Yield on interest-bearing liabilities(1) | 3.88 | % | 4.25 | % | ||||||||||
Spread(3) | 2.61 | % | 3.26 | % | ||||||||||
Net interest margin(4) | 3.16 | % | 3.83 | % | ||||||||||
Efficiency ratio(5) | 74.51 | % | 61.29 | % | ||||||||||
__________________
(1)Non-GAAP financial measure. See "Non-GAAP Financial Measures" section of this press release for a reconciliation to the most directly comparable GAAP measure.
(2)Annualized.
(3)Spread represents the difference between the annualized weighted average yield on interest-earning assets and the annualized weighted average rate paid on interest-bearing liabilities.
(4)Net interest margin is computed by dividing annualized net interest income by total average interest-earning assets.
(5)Efficiency ratio is calculated by dividing non-interest expense by total revenue, which equals the sum of net interest income and non-interest income.
14
FORBRIGHT, INC. AND SUBSIDIARIES
Average Balance Sheets
(Unaudited)
| For the Three Months Ended | ||||||||||||||||||||||||||||||||||||||||||||||||||||||||
| September 30, 2026 | June 30, 2026 | Change Due To: | ||||||||||||||||||||||||||||||||||||||||||||||||||||||
| (dollars in thousands) | Average Balance | Interest Income/Expense | Average Yields Earned/Rates Paid(1) | Average Balance | Interest Income/Expense | Average Yields Earned/Rates Paid(1) | Volume and Days | Yield/Rate | Total Change | |||||||||||||||||||||||||||||||||||||||||||||||
| Assets: | ||||||||||||||||||||||||||||||||||||||||||||||||||||||||
| Total loans held for investment | $ | 5,915,470 | $ | 110,628 | 7.42 | % | $ | 5,409,608 | $ | 98,522 | 7.30 | % | $ | 10,397 | $ | 1,709 | $ | 12,106 | ||||||||||||||||||||||||||||||||||||||
| Total loans held-for-sale | 478,158 | 10,016 | 8.31 | % | 427,940 | 8,484 | 7.95 | % | 1,102 | 430 | 1,532 | |||||||||||||||||||||||||||||||||||||||||||||
| Total loans | 6,393,628 | 120,644 | 7.49 | % | 5,837,548 | 107,006 | 7.35 | % | 11,499 | 2,139 | 13,638 | |||||||||||||||||||||||||||||||||||||||||||||
| Total investment securities | 1,150,488 | 13,052 | 4.50 | % | 1,263,848 | 14,158 | 4.49 | % | (1,128) | 22 | (1,106) | |||||||||||||||||||||||||||||||||||||||||||||
Interest-bearing deposits with banks(2) | 1,380,609 | 12,991 | 3.73 | % | 787,320 | 7,252 | 3.69 | % | 5,603 | 136 | 5,739 | |||||||||||||||||||||||||||||||||||||||||||||
| Other earnings assets | 50,570 | 651 | 5.11 | % | 50,661 | 648 | 5.13 | % | 6 | (3) | 3 | |||||||||||||||||||||||||||||||||||||||||||||
| Total interest-earning assets | 8,975,295 | 147,338 | 6.51 | % | 7,939,377 | 129,064 | 6.52 | % | 15,980 | 2,294 | 18,274 | |||||||||||||||||||||||||||||||||||||||||||||
| Allowance for credit losses | (54,165) | (53,328) | ||||||||||||||||||||||||||||||||||||||||||||||||||||||
| Other assets | 322,604 | 336,948 | ||||||||||||||||||||||||||||||||||||||||||||||||||||||
| Total assets | $ | 9,243,734 | $ | 8,222,997 | ||||||||||||||||||||||||||||||||||||||||||||||||||||
| Liabilities, redeemable noncontrolling interest, and stockholders’ equity: | ||||||||||||||||||||||||||||||||||||||||||||||||||||||||
Interest-bearing demand deposits(2) | $ | 279,995 | $ | 2,459 | 3.48 | % | $ | 283,305 | $ | 2,442 | 3.46 | % | $ | (2) | $ | 19 | $ | 17 | ||||||||||||||||||||||||||||||||||||||
Money market deposits(2) | 1,397,681 | 13,271 | 3.77 | % | 1,403,392 | 13,138 | 3.75 | % | 90 | 43 | 133 | |||||||||||||||||||||||||||||||||||||||||||||
Savings deposits(2) | 4,594,382 | 44,597 | 3.85 | % | 3,680,352 | 34,725 | 3.78 | % | 9,100 | 772 | 9,872 | |||||||||||||||||||||||||||||||||||||||||||||
Time deposits(2) | 1,276,449 | 13,150 | 4.09 | % | 1,310,156 | 13,719 | 4.20 | % | (205) | (364) | (569) | |||||||||||||||||||||||||||||||||||||||||||||
Total interest-bearing deposits(2) | 7,548,507 | 73,477 | 3.86 | % | 6,677,205 | 64,024 | 3.85 | % | 8,983 | 470 | 9,453 | |||||||||||||||||||||||||||||||||||||||||||||
| Subordinated debt, net | 151,211 | 1,909 | 5.01 | % | 151,123 | 1,895 | 5.03 | % | 21 | (7) | 14 | |||||||||||||||||||||||||||||||||||||||||||||
| Total interest-bearing liabilities | 7,699,718 | 75,386 | 3.88 | % | 6,828,328 | 65,919 | 3.87 | % | 9,004 | 463 | 9,467 | |||||||||||||||||||||||||||||||||||||||||||||
Non-interest-bearing demand deposits(2) | 435,418 | 408,649 | ||||||||||||||||||||||||||||||||||||||||||||||||||||||
| Other liabilities | 110,733 | 113,261 | ||||||||||||||||||||||||||||||||||||||||||||||||||||||
| Total liabilities | 8,245,869 | 7,350,238 | ||||||||||||||||||||||||||||||||||||||||||||||||||||||
| Redeemable noncontrolling interest | 65 | — | ||||||||||||||||||||||||||||||||||||||||||||||||||||||
| Stockholders’ equity | 997,800 | 872,759 | ||||||||||||||||||||||||||||||||||||||||||||||||||||||
| Total liabilities, redeemable noncontrolling interest, and stockholders’ equity | $ | 9,243,734 | $ | 8,222,997 | ||||||||||||||||||||||||||||||||||||||||||||||||||||
Net interest income and spread(3) | $ | 71,952 | 2.63 | % | $ | 63,145 | 2.65 | % | $ | 6,976 | $ | 1,831 | $ | 8,807 | ||||||||||||||||||||||||||||||||||||||||||
Net interest margin(4) | 3.18 | % | 3.19 | % | ||||||||||||||||||||||||||||||||||||||||||||||||||||
Total deposits(5) | $ | 7,983,925 | $ | 73,477 | 3.65 | % | $ | 7,085,854 | $ | 64,024 | 3.62 | % | ||||||||||||||||||||||||||||||||||||||||||||
Total funds(6) | $ | 8,135,136 | $ | 75,386 | 3.68 | % | $ | 7,236,977 | $ | 65,919 | 3.65 | % | ||||||||||||||||||||||||||||||||||||||||||||
__________________
(1)Annualized.
(2)Includes balances held-for-sale.
(3)Spread represents the difference between the annualized weighted average yield on interest-earning assets and the annualized weighted average rate paid on interest-bearing liabilities.
(4)Net interest margin is computed by dividing annualized net interest income by total average interest-earning assets.
(5)Total deposits is the sum of interest-bearing deposits and non-interest-bearing demand deposits. Cost of total deposits is calculated as annualized interest expense on total deposits divided by average total deposits.
(6)Total funds is the sum of total interest-bearing liabilities and non-interest-bearing demand deposits. Cost of total funds is calculated as annualized total interest expense divided by average total funds.
15
FORBRIGHT, INC. AND SUBSIDIARIES
Average Balance Sheets
(Unaudited)
| For the Nine Months Ended | ||||||||||||||||||||||||||||||||||||||||||||||||||||||||
| September 30, 2026 | September 30, 2025 | Change Due To: | ||||||||||||||||||||||||||||||||||||||||||||||||||||||
| (dollars in thousands) | Average Balance | Interest Income/Expense | Average Yields Earned/Rates Paid(1) | Average Balance | Interest Income/Expense | Average Yields Earned/Rates Paid(1) | Volume | Yield/Rate | Total Change | |||||||||||||||||||||||||||||||||||||||||||||||
| Assets: | ||||||||||||||||||||||||||||||||||||||||||||||||||||||||
| Total loans held for investment | $ | 5,515,747 | $ | 302,314 | 7.33 | % | $ | 4,399,127 | $ | 283,584 | 8.62 | % | $ | 71,981 | $ | (53,251) | $ | 18,730 | ||||||||||||||||||||||||||||||||||||||
| Total loans held-for-sale | 436,071 | 26,694 | 8.18 | % | 331,859 | 28,274 | 11.39 | % | 8,879 | (10,459) | (1,580) | |||||||||||||||||||||||||||||||||||||||||||||
| Total loans | 5,951,818 | 329,008 | 7.39 | % | 4,730,986 | 311,858 | 8.81 | % | 80,860 | (63,710) | 17,150 | |||||||||||||||||||||||||||||||||||||||||||||
| Total investment securities | 1,234,738 | 41,309 | 4.47 | % | 1,382,032 | 47,359 | 4.58 | % | (5,047) | (1,003) | (6,050) | |||||||||||||||||||||||||||||||||||||||||||||
Interest-bearing deposits with banks(2) | 1,003,361 | 27,825 | 3.71 | % | 669,160 | 22,182 | 4.43 | % | 11,079 | (5,436) | 5,643 | |||||||||||||||||||||||||||||||||||||||||||||
| Other earnings assets | 52,066 | 2,015 | 5.17 | % | 57,639 | 2,564 | 5.95 | % | (248) | (301) | (549) | |||||||||||||||||||||||||||||||||||||||||||||
| Total interest-earning assets | 8,241,983 | 400,157 | 6.49 | % | 6,839,817 | 383,963 | 7.51 | % | 86,644 | (70,450) | 16,194 | |||||||||||||||||||||||||||||||||||||||||||||
| Allowance for credit losses | (53,399) | (45,149) | ||||||||||||||||||||||||||||||||||||||||||||||||||||||
| Other assets | 312,281 | 225,901 | ||||||||||||||||||||||||||||||||||||||||||||||||||||||
| Total assets | $ | 8,500,865 | $ | 7,020,569 | ||||||||||||||||||||||||||||||||||||||||||||||||||||
| Liabilities, redeemable noncontrolling interest, and stockholders’ equity: | ||||||||||||||||||||||||||||||||||||||||||||||||||||||||
Interest-bearing demand deposits(2) | $ | 281,426 | $ | 7,334 | 3.48 | % | $ | 296,158 | $ | 8,306 | 3.75 | % | $ | (413) | $ | (559) | $ | (972) | ||||||||||||||||||||||||||||||||||||||
Money market deposits(2) | 1,374,655 | 38,598 | 3.75 | % | 862,578 | 25,019 | 3.88 | % | 14,853 | (1,274) | 13,579 | |||||||||||||||||||||||||||||||||||||||||||||
Savings deposits(2) | 3,941,829 | 112,430 | 3.81 | % | 2,787,657 | 87,607 | 4.20 | % | 36,272 | (11,449) | 24,823 | |||||||||||||||||||||||||||||||||||||||||||||
Time deposits(2) | 1,327,777 | 41,434 | 4.17 | % | 1,765,116 | 58,776 | 4.45 | % | (14,563) | (2,779) | (17,342) | |||||||||||||||||||||||||||||||||||||||||||||
Total interest-bearing deposits(2) | 6,925,687 | 199,796 | 3.86 | % | 5,711,509 | 179,708 | 4.21 | % | 36,149 | (16,061) | 20,088 | |||||||||||||||||||||||||||||||||||||||||||||
| Subordinated debt, net | 151,123 | 5,706 | 5.05 | % | 166,524 | 6,893 | 5.53 | % | (637) | (550) | (1,187) | |||||||||||||||||||||||||||||||||||||||||||||
| Other borrowings | — | — | — | % | 41,342 | 1,388 | 4.49 | % | (1,388) | — | (1,388) | |||||||||||||||||||||||||||||||||||||||||||||
| Total interest-bearing liabilities | 7,076,810 | 205,502 | 3.88 | % | 5,919,375 | 187,989 | 4.25 | % | 34,124 | (16,611) | 17,513 | |||||||||||||||||||||||||||||||||||||||||||||
Non-interest-bearing demand deposits(2) | 405,776 | 269,594 | ||||||||||||||||||||||||||||||||||||||||||||||||||||||
| Other liabilities | 114,499 | 74,919 | ||||||||||||||||||||||||||||||||||||||||||||||||||||||
| Total liabilities | 7,597,085 | 6,263,888 | ||||||||||||||||||||||||||||||||||||||||||||||||||||||
| Redeemable noncontrolling interest | 22 | — | ||||||||||||||||||||||||||||||||||||||||||||||||||||||
| Stockholders’ equity | 903,758 | 756,681 | ||||||||||||||||||||||||||||||||||||||||||||||||||||||
| Total liabilities, redeemable noncontrolling interest, and stockholders’ equity | $ | 8,500,865 | $ | 7,020,569 | ||||||||||||||||||||||||||||||||||||||||||||||||||||
Net interest income and spread(3) | $ | 194,655 | 2.61 | % | $ | 195,974 | 3.26 | % | $ | 52,520 | $ | (53,839) | $ | (1,319) | ||||||||||||||||||||||||||||||||||||||||||
Net interest margin(4) | 3.16 | % | 3.83 | % | ||||||||||||||||||||||||||||||||||||||||||||||||||||
Total deposits(5) | $ | 7,331,463 | $ | 199,796 | 3.64 | % | $ | 5,981,103 | $ | 179,708 | 4.02 | % | ||||||||||||||||||||||||||||||||||||||||||||
Total funds(6) | $ | 7,482,586 | $ | 205,502 | 3.67 | % | $ | 6,188,969 | $ | 187,989 | 4.06 | % | ||||||||||||||||||||||||||||||||||||||||||||
__________________
(1)Annualized.
(2)Includes balances held-for-sale.
(3)Spread represents the difference between the annualized weighted average yield on interest-earning assets and the annualized weighted average rate paid on interest-bearing liabilities.
(4)Net interest margin is computed by dividing annualized net interest income by total average interest-earning assets.
(5)Total deposits is the sum of interest-bearing deposits and non-interest-bearing demand deposits. Cost of total deposits is calculated as annualized interest expense on total deposits divided by average total deposits.
(6)Total funds is the sum of total interest-bearing liabilities and non-interest-bearing demand deposits. Cost of total funds is calculated as annualized total interest expense divided by average total funds.
16
FORBRIGHT, INC. AND SUBSIDIARIES
Loans Held for Investment at Amortized Cost
(Unaudited)
| September 30, 2026 | June 30, 2026 | December 31, 2025 | ||||||||||||||||||||||||||||||||||||
| (dollars in thousands) | Amount | % of total loans | Amount | % of total loans | Amount | % of total loans | ||||||||||||||||||||||||||||||||
| Commercial Real Estate | $ | 3,055,047 | 49.6 | % | $ | 2,849,478 | 50.9 | % | $ | 2,528,996 | 48.4 | % | ||||||||||||||||||||||||||
| Commercial and Industrial | 2,911,601 | 47.2 | % | 2,541,275 | 45.4 | % | 2,475,549 | 47.4 | % | |||||||||||||||||||||||||||||
| Consumer | 197,068 | 3.2 | % | 205,119 | 3.7 | % | 217,689 | 4.2 | % | |||||||||||||||||||||||||||||
| Total loans held for investment at amortized cost | $ | 6,163,716 | 100.0 | % | $ | 5,595,872 | 100.0 | % | $ | 5,222,234 | 100.0 | % | ||||||||||||||||||||||||||
17
FORBRIGHT, INC. AND SUBSIDIARIES
Allowance for Credit Losses - Loans Held for Investment at Amortized Cost
(Unaudited)
As of and For the Three Months Ended | As of and For the Nine Months Ended | |||||||||||||||||||||||||
| (dollars in thousands) | September 30, 2026 | June 30, 2026 | September 30, 2026 | September 30, 2025 | ||||||||||||||||||||||
| Average loans held for investment outstanding, at amortized cost | $ | 5,912,148 | $ | 5,405,685 | $ | 5,511,752 | $ | 4,392,511 | ||||||||||||||||||
| Total loans held for investment outstanding, at amortized cost at end of period | $ | 6,163,716 | $ | 5,595,872 | $ | 6,163,716 | $ | 4,987,894 | ||||||||||||||||||
| ACL - Loans: | ||||||||||||||||||||||||||
| Beginning of period | $ | 54,621 | $ | 52,794 | $ | 52,986 | $ | 42,294 | ||||||||||||||||||
| Provision for credit losses on loans | 879 | 4,521 | 9,267 | 16,569 | ||||||||||||||||||||||
| Provision for credit losses on loan transfers from loans held-for-sale | 1,579 | — | 1,596 | 97 | ||||||||||||||||||||||
| Loan charge-offs: | ||||||||||||||||||||||||||
| Commercial Real Estate | (472) | — | (472) | — | ||||||||||||||||||||||
| Commercial and Industrial | — | (1,736) | (4,566) | (4,252) | ||||||||||||||||||||||
| Consumer | (1,444) | (1,353) | (4,854) | (5,409) | ||||||||||||||||||||||
| Total charge-offs | (1,916) | (3,089) | (9,892) | (9,661) | ||||||||||||||||||||||
| Loan recoveries: | ||||||||||||||||||||||||||
| Commercial Real Estate | — | — | — | — | ||||||||||||||||||||||
| Commercial and Industrial | 339 | 131 | 1,012 | 1,105 | ||||||||||||||||||||||
| Consumer | 331 | 264 | 864 | 1,026 | ||||||||||||||||||||||
| Total recoveries | 670 | 395 | 1,876 | 2,131 | ||||||||||||||||||||||
| Net charge-offs | (1,246) | (2,694) | (8,016) | (7,530) | ||||||||||||||||||||||
| End of period | $ | 55,833 | $ | 54,621 | $ | 55,833 | $ | 51,430 | ||||||||||||||||||
| Ratio of ACL - Loans to total loans at amortized cost at period end | 0.91 | % | 0.98 | % | 0.91 | % | 1.03 | % | ||||||||||||||||||
| Ratio of net charge-offs to average total loans at amortized cost | (0.08) | % | (0.20) | % | (0.19) | % | (0.23) | % | ||||||||||||||||||
18
FORBRIGHT, INC. AND SUBSIDIARIES
Non-performing Assets and Non-performing Loans
(Unaudited)
| (dollars in thousands) | September 30, 2026 | June 30, 2026 | December 31, 2025 | |||||||||||||||||
| NON-PERFORMING ASSETS | ||||||||||||||||||||
| Total non-accrual loans: | ||||||||||||||||||||
| Commercial Real Estate | $ | 52,544 | $ | 67,312 | $ | 60,360 | ||||||||||||||
| Commercial and Industrial | 12,368 | 19,498 | 11,798 | |||||||||||||||||
| Consumer | 1,189 | 1,407 | 1,857 | |||||||||||||||||
| Total non-accrual loans | 66,101 | 88,217 | 74,015 | |||||||||||||||||
| Accruing loans 90 days or more past due | — | — | — | |||||||||||||||||
| Non-performing investment securities | 839 | 839 | 839 | |||||||||||||||||
| Non-performing financing receivables | — | — | — | |||||||||||||||||
| Other real estate owned | 7,934 | 4,642 | 8,729 | |||||||||||||||||
| Total non-performing assets | $ | 74,874 | $ | 93,698 | $ | 83,583 | ||||||||||||||
| Total non-accrual loans as a percentage of total loans | 1.00 | % | 1.45 | % | 1.32 | % | ||||||||||||||
| Total non-performing investment securities as a percentage of total investment securities | 0.08 | % | 0.07 | % | 0.06 | % | ||||||||||||||
| Total non-performing financing receivables as a percentage of total financing receivables | — | % | — | % | — | % | ||||||||||||||
| Total non-performing assets as a percentage of total assets | 0.78 | % | 1.10 | % | 1.06 | % | ||||||||||||||
| NON-PERFORMING LOANS HELD FOR INVESTMENT AT AMORTIZED COST | ||||||||||||||||||||
| Total non-accrual loans held for investment at amortized cost: | ||||||||||||||||||||
| Commercial Real Estate | $ | 52,544 | $ | 67,312 | $ | 60,361 | ||||||||||||||
| Commercial and Industrial | 2,473 | 3,752 | 5,484 | |||||||||||||||||
| Consumer | 1,189 | 1,407 | 1,857 | |||||||||||||||||
| Total non-accrual loans | 56,206 | 72,471 | 67,702 | |||||||||||||||||
| Accruing loans 90 days or more past due | — | — | — | |||||||||||||||||
| Total non-performing loans held for investment at amortized cost | $ | 56,206 | $ | 72,471 | $ | 67,702 | ||||||||||||||
| Total non-accrual loans held for investment at amortized cost to total loans held for investment at amortized cost | 0.91 | % | 1.30 | % | 1.30 | % | ||||||||||||||
| Total ACL - Loans to total non-accrual loans held for investment at amortized cost | 99.34 | % | 75.37 | % | 78.26 | % | ||||||||||||||
| Non-performing loans held for investment at amortized cost to total loans held for investment at amortized cost | 0.91 | % | 1.30 | % | 1.30 | % | ||||||||||||||
19
FORBRIGHT, INC. AND SUBSIDIARIES
Investment Securities
(Unaudited)
| September 30, 2026 | June 30, 2026 | December 31, 2025 | ||||||||||||||||||||||||||||||||||||
| (dollars in thousands) | Amount(1) | % of total securities | Amount(1) | % of total securities | Amount(1) | % of total securities | ||||||||||||||||||||||||||||||||
| Available-for-sale securities: | ||||||||||||||||||||||||||||||||||||||
| U.S. Treasury and government agencies | $ | 515,996 | 48.6 | % | $ | 695,844 | 55.3 | % | $ | 958,347 | 73.4 | % | ||||||||||||||||||||||||||
| Residential agency mortgage-backed | 294,559 | 27.7 | % | 312,973 | 24.8 | % | 139,077 | 10.7 | % | |||||||||||||||||||||||||||||
| Commercial agency mortgage-backed | 186,180 | 17.5 | % | 182,856 | 14.5 | % | 136,070 | 10.4 | % | |||||||||||||||||||||||||||||
| Municipal bonds | 7,937 | 0.7 | % | 8,635 | 0.7 | % | 8,635 | 0.7 | % | |||||||||||||||||||||||||||||
| Other | 9,933 | 0.9 | % | 10,357 | 0.8 | % | 12,758 | 1.0 | % | |||||||||||||||||||||||||||||
| Total investment securities available-for-sale | $ | 1,014,605 | 95.4 | % | $ | 1,210,665 | 96.1 | % | $ | 1,254,887 | 96.2 | % | ||||||||||||||||||||||||||
| Held-to-maturity securities: | ||||||||||||||||||||||||||||||||||||||
| Municipal bonds | $ | 31,000 | 2.9 | % | $ | 31,000 | 2.5 | % | $ | 31,200 | 2.4 | % | ||||||||||||||||||||||||||
| Other | 17,599 | 1.7 | % | 17,744 | 1.4 | % | 17,744 | 1.4 | % | |||||||||||||||||||||||||||||
| Total investment securities held-to-maturity | $ | 48,599 | 4.6 | % | $ | 48,744 | 3.9 | % | $ | 48,944 | 3.8 | % | ||||||||||||||||||||||||||
| Total investment securities | $ | 1,063,204 | 100.0 | % | $ | 1,259,409 | 100.0 | % | $ | 1,303,831 | 100.0 | % | ||||||||||||||||||||||||||
__________________
(1)Available-for-sale investment securities are reported at fair value and held-to-maturity investment securities are reported at amortized cost.
20
FORBRIGHT, INC. AND SUBSIDIARIES
Deposits
(Unaudited)
| September 30, 2026 | June 30, 2026 | December 31, 2025 | ||||||||||||||||||||||||||||||||||||
| (dollars in thousands) | Amount | % of total | Amount | % of total | Amount | % of total | ||||||||||||||||||||||||||||||||
| Non-interest-bearing deposits | $ | 362,080 | 4.8 | % | $ | 435,065 | 6.0 | % | $ | 372,444 | 5.5 | % | ||||||||||||||||||||||||||
| Interest-bearing deposits: | ||||||||||||||||||||||||||||||||||||||
| Demand | 108,987 | 1.4 | % | 284,748 | 3.9 | % | 275,259 | 4.1 | % | |||||||||||||||||||||||||||||
| Money market | 1,146,396 | 15.1 | % | 1,394,865 | 19.2 | % | 1,206,544 | 17.8 | % | |||||||||||||||||||||||||||||
| Savings | 4,914,624 | 64.5 | % | 3,878,206 | 53.4 | % | 3,500,532 | 51.6 | % | |||||||||||||||||||||||||||||
| Time deposits | 1,078,583 | 14.2 | % | 1,272,951 | 17.5 | % | 1,423,136 | 21.0 | % | |||||||||||||||||||||||||||||
| Total interest-bearing deposits | 7,248,590 | 95.2 | % | 6,830,770 | 94.0 | % | 6,405,471 | 94.5 | % | |||||||||||||||||||||||||||||
Total deposits(1) | $ | 7,610,670 | 100.0 | % | $ | 7,265,835 | 100.0 | % | $ | 6,777,915 | 100.0 | % | ||||||||||||||||||||||||||
__________________
(1)Excludes balances held-for-sale.
21
FORBRIGHT, INC. AND SUBSIDIARIES
Capital Ratios
(Unaudited)
September 30, 2026(1) | June 30, 2026 | December 31, 2025 | ||||||||||||||||||
| Company: | ||||||||||||||||||||
| Tier 1 leverage ratio | 9.80 | % | 10.38 | % | 9.79 | % | ||||||||||||||
| Total capital to risk-weighted assets ratio | 15.74 | % | 16.05 | % | 15.89 | % | ||||||||||||||
| Tier 1 capital to risk-weighted assets ratio | 12.87 | % | 12.97 | % | 12.72 | % | ||||||||||||||
| Common Equity Tier 1 to risk weighted-assets ratio | 12.87 | % | 12.97 | % | 12.72 | % | ||||||||||||||
| Bank: | ||||||||||||||||||||
| Tier 1 leverage ratio | 10.41 | % | 11.24 | % | 11.11 | % | ||||||||||||||
| Total capital to risk-weighted assets ratio | 14.52 | % | 14.98 | % | 15.14 | % | ||||||||||||||
| Tier 1 capital to risk-weighted assets ratio | 13.68 | % | 14.08 | % | 14.37 | % | ||||||||||||||
| Common Equity Tier 1 to risk weighted-assets ratio | 13.68 | % | 14.08 | % | 14.37 | % | ||||||||||||||
__________________
(1)Regulatory capital ratios as of September 30, 2026 are preliminary pending filing of regulatory reports.
22
FORBRIGHT, INC. AND SUBSIDIARIES
Non-GAAP Financial Measures
(Unaudited)
This earnings release contains “non-GAAP financial measures” within the meaning of Item 10(e) of Regulation S-K. Non-GAAP financial measures are financial measures that are not presented in accordance with GAAP. We use these non-GAAP financial measures in the internal evaluation of our performance and management of our business as well as to explain our results of operations to stockholders and the wider investment community. The following non-GAAP financial measures appear in this earnings release:
•Tangible common equity - We calculate tangible common equity by deducting goodwill and other intangible assets from stockholders' equity.
•Tangible common equity per common share - We calculate tangible common equity per common share by dividing tangible common equity, as defined above, by our total common shares outstanding for the period, excluding the dilutive effect of outstanding stock options, and including the effect of outstanding shares from restricted stock awards.
•Return on average tangible common equity - We calculate return on average tangible common equity by dividing adjusted net income for the period by average tangible common equity over the same period. Adjusted net income, used for the calculation of return on average tangible common equity, is calculated by adding back the tax effected amount of intangible asset amortization to net income.
•Non-core trust administration - We calculate non-core trust administration by deducting fixed monthly trust administration fees from trust administration, a component of other non-interest income as reported in the footnotes to the Consolidated Financial Statements. Non-core trust administration represents the reimbursements we receive for various expenses incurred in administration of the trusts.
•Non-core gains/(losses) on sales of loans and investment securities, net - We calculate non-core gains/(losses) on sales of loans and investment securities, net by deducting gains from sales of loans to Alliance Partners from gains/(losses) on sales of loans and investment securities, net, as reported on the Consolidated Statements of Income.
•Core and non-core non-interest income - Core non-interest income equals total non-interest income less (a) non-core trust administration, (b) non-core gains/(losses) on sales of loan and investment securities, net, (c) unrealized gains on loans and financing receivables, net, (d) rental income and (e) other income. Non-core non-interest income equals total non-interest income less core non-interest income.
•Adjusted total revenue - We calculate adjusted total revenue by deducting non-core non-interest income from total revenue.
•Pre provision net revenue - We calculate pre provision net revenue by adding provision for credit losses to income before income taxes.
Our management believes that these non-GAAP financial measures and the information they provide are useful to investors because these measures allow investors to view our performance in the same manner our management evaluates performance. Although we believe these non-GAAP financial measures are useful in evaluating our performance, these non-GAAP financial measures should not be considered in isolation or as a substitution for the most directly comparable or other financial measures presented in this earnings release under GAAP. Additionally, the manner in which we calculate these non-GAAP financial measures may be different from how other companies calculate financial measures with similar names.
23
FORBRIGHT, INC. AND SUBSIDIARIES
Non-GAAP Financial Measures - (continued)
(Unaudited)
As of and For the Three Months Ended | As of and For the Nine Months Ended | |||||||||||||||||||||||||
| (dollars in thousands, except per share data) | September 30, 2026 | June 30, 2026 | September 30, 2026 | September 30, 2025 | ||||||||||||||||||||||
| Tangible common equity | ||||||||||||||||||||||||||
| Stockholders’ equity (GAAP) | $ | 991,749 | $ | 967,163 | $ | 991,749 | $ | 789,773 | ||||||||||||||||||
| Less: | ||||||||||||||||||||||||||
| Goodwill | 18,519 | 18,519 | 18,519 | 18,519 | ||||||||||||||||||||||
| Other intangible assets | 16,933 | 17,445 | 16,933 | 13,507 | ||||||||||||||||||||||
| Tangible common equity (non-GAAP) | $ | 956,297 | $ | 931,199 | $ | 956,297 | $ | 757,747 | ||||||||||||||||||
| Total common shares outstanding | 50,764,380 | 49,697,208 | 50,764,380 | 40,653,612 | ||||||||||||||||||||||
| Stockholders’ equity per total common share outstanding (GAAP) | $ | 19.54 | $ | 19.46 | $ | 19.54 | $ | 19.43 | ||||||||||||||||||
| Tangible common equity per total common share outstanding (non-GAAP) | $ | 18.84 | $ | 18.74 | $ | 18.84 | $ | 18.64 | ||||||||||||||||||
| Return on average tangible common equity | ||||||||||||||||||||||||||
| Average stockholders' equity (GAAP) | $ | 997,800 | $ | 872,759 | $ | 903,758 | $ | 756,681 | ||||||||||||||||||
| Less: | ||||||||||||||||||||||||||
| Average goodwill | 18,519 | 18,519 | 18,519 | 18,519 | ||||||||||||||||||||||
| Average other intangible assets | 15,713 | 12,839 | 13,883 | 14,068 | ||||||||||||||||||||||
| Average tangible common equity (non-GAAP) | $ | 963,568 | $ | 841,401 | $ | 871,356 | $ | 724,094 | ||||||||||||||||||
| Net income attributable to the Company (GAAP) | $ | 20,623 | $ | 4,122 | $ | 36,377 | $ | 58,332 | ||||||||||||||||||
| Add: | ||||||||||||||||||||||||||
| Intangible asset amortization, net of tax | 448 | 476 | 1,134 | 757 | ||||||||||||||||||||||
| Adjusted net income attributable to the Company (non-GAAP) | $ | 21,071 | $ | 4,598 | $ | 37,511 | $ | 59,089 | ||||||||||||||||||
| Return on average stockholders’ equity (GAAP) | 8.20 | % | 1.89 | % | 5.38 | % | 10.31 | % | ||||||||||||||||||
| Return on average tangible common equity (non-GAAP) | 8.68 | % | 2.19 | % | 5.76 | % | 10.91 | % | ||||||||||||||||||
| Non-core trust administration (non-GAAP) | ||||||||||||||||||||||||||
| Trust administration (GAAP) | $ | 8,544 | $ | 7,324 | $ | 20,132 | $ | 697 | ||||||||||||||||||
| Less: | ||||||||||||||||||||||||||
| Fixed monthly trust administration fees | 1,345 | 1,327 | 4,092 | (1,237) | ||||||||||||||||||||||
| Non-core trust administration (non-GAAP) | $ | 7,199 | $ | 5,997 | $ | 16,040 | $ | 1,934 | ||||||||||||||||||
| Non-core gains/(losses) on sales of loans and investment securities, net (non-GAAP) | ||||||||||||||||||||||||||
| Gains on sales of loans and investment securities, net (GAAP) | $ | 1,946 | $ | 252 | $ | 2,164 | $ | 12,860 | ||||||||||||||||||
| Less: | ||||||||||||||||||||||||||
| Gains on sales of loans by Alliance Partners | 358 | 252 | 863 | 1,520 | ||||||||||||||||||||||
| Non-core gains/(losses) on sales of loans and investment securities, net (non-GAAP) | $ | 1,588 | $ | — | $ | 1,301 | $ | 11,340 | ||||||||||||||||||
24
FORBRIGHT, INC. AND SUBSIDIARIES
Non-GAAP Financial Measures - (continued)
(Unaudited)
As of and For the Three Months Ended | As of and For the Nine Months Ended | |||||||||||||||||||||||||
| (dollars in thousands, except per share data) | September 30, 2026 | June 30, 2026 | September 30, 2026 | September 30, 2025 | ||||||||||||||||||||||
| Core and non-core non-interest income | ||||||||||||||||||||||||||
| Non-interest income (GAAP) | $ | 29,100 | $ | 21,846 | $ | 66,530 | $ | 49,428 | ||||||||||||||||||
| Less: | ||||||||||||||||||||||||||
| Non-core trust administration (non-GAAP) | 7,199 | 5,997 | 16,040 | 1,934 | ||||||||||||||||||||||
| Non-core gains/(losses) on sales of loans and investment securities, net (non-GAAP) | 1,588 | — | 1,301 | 11,340 | ||||||||||||||||||||||
| Unrealized gains/(losses) on loans and financing receivables, net | 1,263 | (963) | (1,035) | 7,189 | ||||||||||||||||||||||
| Rental income | 2,050 | 1,225 | 3,275 | — | ||||||||||||||||||||||
| Other (included in other non-interest income) | (105) | (137) | (998) | (138) | ||||||||||||||||||||||
| Core non-interest income (non-GAAP) | $ | 17,105 | $ | 15,724 | $ | 47,947 | $ | 29,103 | ||||||||||||||||||
| Non-core non-interest income (non-GAAP) | $ | 11,995 | $ | 6,122 | $ | 18,583 | $ | 20,325 | ||||||||||||||||||
| Adjusted total revenue | ||||||||||||||||||||||||||
| Net interest income | $ | 71,952 | $ | 63,145 | $ | 194,655 | $ | 195,974 | ||||||||||||||||||
| Non-interest income | 29,100 | 21,846 | 66,530 | 49,428 | ||||||||||||||||||||||
| Total revenue (GAAP) | $ | 101,052 | $ | 84,991 | $ | 261,185 | $ | 245,402 | ||||||||||||||||||
| Less: | ||||||||||||||||||||||||||
| Non-core non-interest income (non-GAAP) | 11,995 | 6,122 | 18,583 | 20,325 | ||||||||||||||||||||||
| Adjusted total revenue (non-GAAP) | $ | 89,057 | $ | 78,869 | $ | 242,602 | $ | 225,077 | ||||||||||||||||||
| Non-interest income to total revenue (GAAP) | 28.8 | % | 25.7 | % | 25.5 | % | 20.1 | % | ||||||||||||||||||
| Core non-interest income to adjusted total revenue (non-GAAP) | 19.2 | % | 19.9 | % | 19.8 | % | 12.9 | % | ||||||||||||||||||
| Pre provision net revenue | ||||||||||||||||||||||||||
| Income before income taxes (GAAP) | $ | 29,173 | $ | 13,316 | $ | 55,701 | $ | 77,674 | ||||||||||||||||||
| Add: | ||||||||||||||||||||||||||
| Provision for credit losses | 1,499 | 5,899 | 10,871 | 17,311 | ||||||||||||||||||||||
| Pre provision net revenue (non-GAAP) | $ | 30,672 | $ | 19,215 | $ | 66,572 | $ | 94,985 | ||||||||||||||||||
# # #
25

Investor Presentation Third Quarter 2026 Results
Forward Looking Statements Cautionary Note Regarding Forward-Looking Statements This presentation may contain, forward-looking statements. These forward-looking statements represent plans, estimates, objectives, goals, guidelines, expectations, intentions, projections and statements of our beliefs concerning future events, business plans, objectives, expected operating results and the assumptions upon which those statements are based. Forward-looking statements include, without limitation, any statement that may predict, forecast, indicate or imply future results, performance or achievements, and are typically identified with words such as “may,” “could,” “should,” “will,” “would,” “believe,” “anticipate,” “estimate,” “expect,” “aim,” “intend,” “plan” or words or phrases of similar meaning. We caution that the forward-looking statements are based largely on our expectations and are subject to a number of known and unknown risks and uncertainties that are subject to change based on factors which are, in many instances, beyond our control. Such forward-looking statements are based on various assumptions (some of which may be beyond our control) and are subject to risks and uncertainties, which change over time, and other factors which could cause actual results to differ materially from those currently anticipated. Such risks and uncertainties include, but are not limited to: economic conditions that impact the financial services industry and/or our business; our ability to manage our credit risk effectively and the potential deterioration of the business and economic conditions in our primary market areas; the composition of our loan portfolio; our ability to achieve organic loan and deposit growth and the composition of such growth; our ability to maintain our bank’s reputation; our ability to attract and retain skilled employees and manage changes in our management personnel; risks associated with unauthorized access, cyber-crime and other threats to data security; our ability to effectively compete with other financial services companies and the effects of competition in the financial services industry on our business; our ability to successfully develop and commercialize new or enhanced products and services; changes in the demand for our products and services; the sufficiency of our capital, including sources of capital and the extent to which we may be required to raise additional capital to meet our goals; the effectiveness of our risk management an d internal disclosure controls and procedures; our access to sources of liquidity and capital to address our liquidity needs; the effects of the failure of any component of our business infrastructure provided by a third-party; any failure or interruption of our information and communications systems; the impact of, and changes in applicable laws, regulations and accounting standards and policies; the effects of geopolitical instability, including war, terrorist attacks, and man-made and natural disasters; our ability to keep pace with technological changes; the effects of problems encountered by other financial institutions; the ability to adapt to rapid technological changes, including advancements related to artificial intelligence ("AI"), the use of AI models in credit decisioning, customer service, and operations, including risks of model error, bias, regulatory scrutiny under fair lending laws, and third -party AI dependencies, digital banking platforms, and cybersecurity; advances and changes in technology, including AI, and the Company's ability to develop timely and competitive products and services and effectively manage related risks; r isks related to our implementation of new lines of business, new products and services, new technologies, and expansion of our existing business opportunities; risks related to the development and use of AI; and other risks and uncertainties described under “Risk Factors” of our Quarterly Report on Form 10-Q for the quarterly period ended June 30, 2026, and subsequent filings with the U.S. Securities and Exchange Commission. All such factors are difficult to predict, contain uncertainties that may materially affect actual results and may be beyond our control. New factors emerge from time to time, and it is not possible for management to predict all such factors or to assess the impact of each such factor on the Company. Any forward-looking statement speaks only as of the date on which such statement is made, and we do not undertake any obligation to update any forward- looking statement to reflect events or circumstances after the date on which such statement is made except as required by the federal securities laws. If one or more of these or other risks or uncertainties materialize, or if our underlying assumptions prove to be incorrect, our actual results may vary materially from what we may have expressed or implied by these forward- looking statements. We caution that you should not place undue reliance on any of our forward-looking statements. You should specifically consider the factors identified in this presentation that could cause actual results to differ before making an investment decision to purchase our Class A common stock. Furthermore, new risks and uncertainties arise from time to time, and it is impossible for us to predict those events or how they may affect us. Non-GAAP Financial Measures This presentation includes certain financial measures not presented in accordance with generally accepted accounting principles in the United States (“GAAP”). These non-GAAP measures include Adjusted Net Income, Core Non- Interest Income, Adjusted Pre-Provision Net Revenue and Tangible Common Equity. The Company believes that the non-GAAP financial measures provide users of our financial information, including management, investors and others, with useful supplemental information that enables a better comparison of our performance across periods. These non-GAAP financial measures have limitations as analytical tools and should not be considered in isolation from, or as a substitute for, the analysis of related or other GAAP financial measures, such as net income. These non- GAAP financial measures are not universally consistent calculations, limiting their usefulness as comparative measures. Other companies may calculate similarly titled financial measures differently than we do or may not calculate them at all. A reconciliation of such non-GAAP financial measures to the most directly comparable GAAP financial measure can be found in the Appendix to this presentation. Numbers may not foot due to rounding in this presentation. 2
4. Q3 Highlights 5. Earnings and Performance Metrics 12. Lending, Credit, and Fee Businesses 18. Deposits 21. Appendix
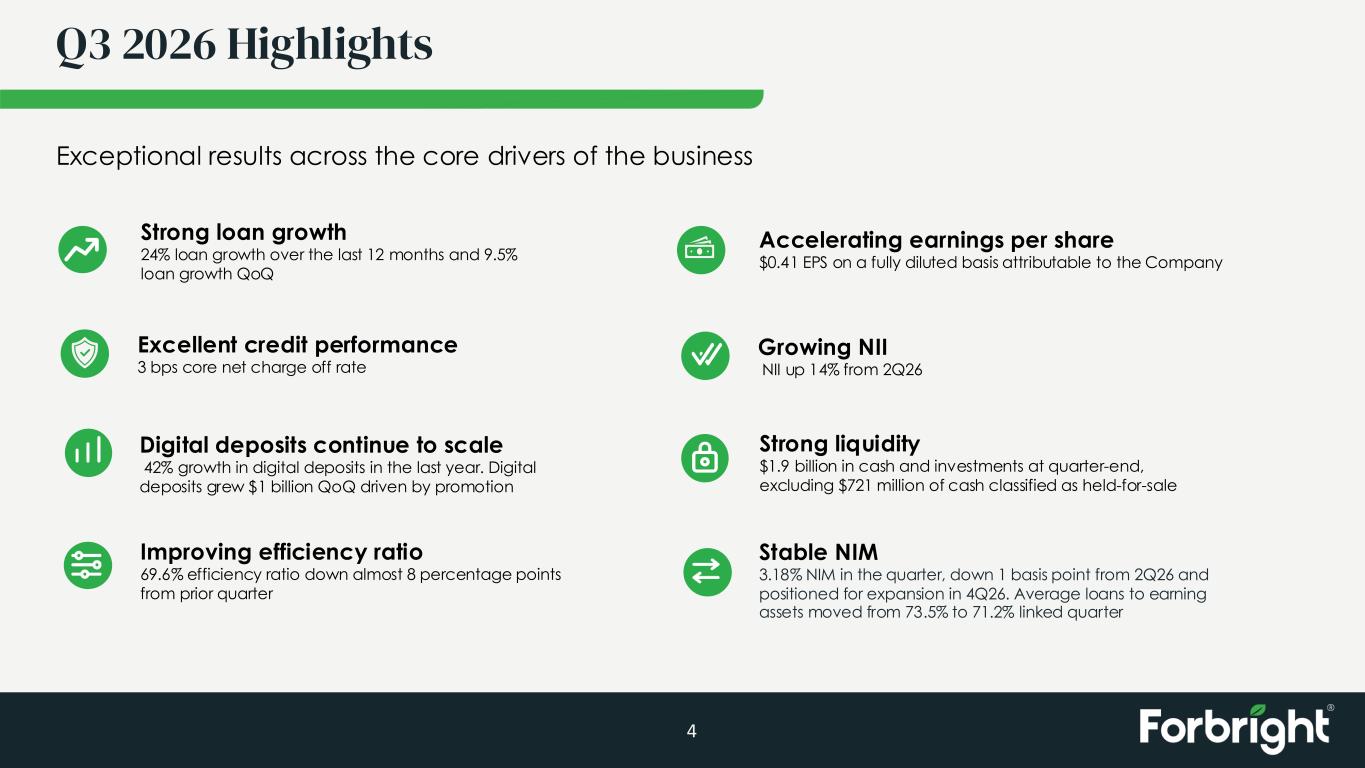
Q3 2026 Highlights 4 Exceptional results across the core drivers of the business Growing NII NII up 14% from 2Q26 Strong loan growth 24% loan growth over the last 12 months and 9.5% loan growth QoQ Excellent credit performance 3 bps core net charge off rate Improving efficiency ratio 69.6% efficiency ratio down almost 8 percentage points from prior quarter Digital deposits continue to scale 42% growth in digital deposits in the last year. Digital deposits grew $1 billion QoQ driven by promotion Strong liquidity $1.9 billion in cash and investments at quarter-end, excluding $721 million of cash classified as held-for-sale Stable NIM 3.18% NIM in the quarter, down 1 basis point from 2Q26 and positioned for expansion in 4Q26. Average loans to earning assets moved from 73.5% to 71.2% linked quarter Accelerating earnings per share $0.41 EPS on a fully diluted basis attributable to the Company

5 Q3 2026 Earnings and Performance Metrics
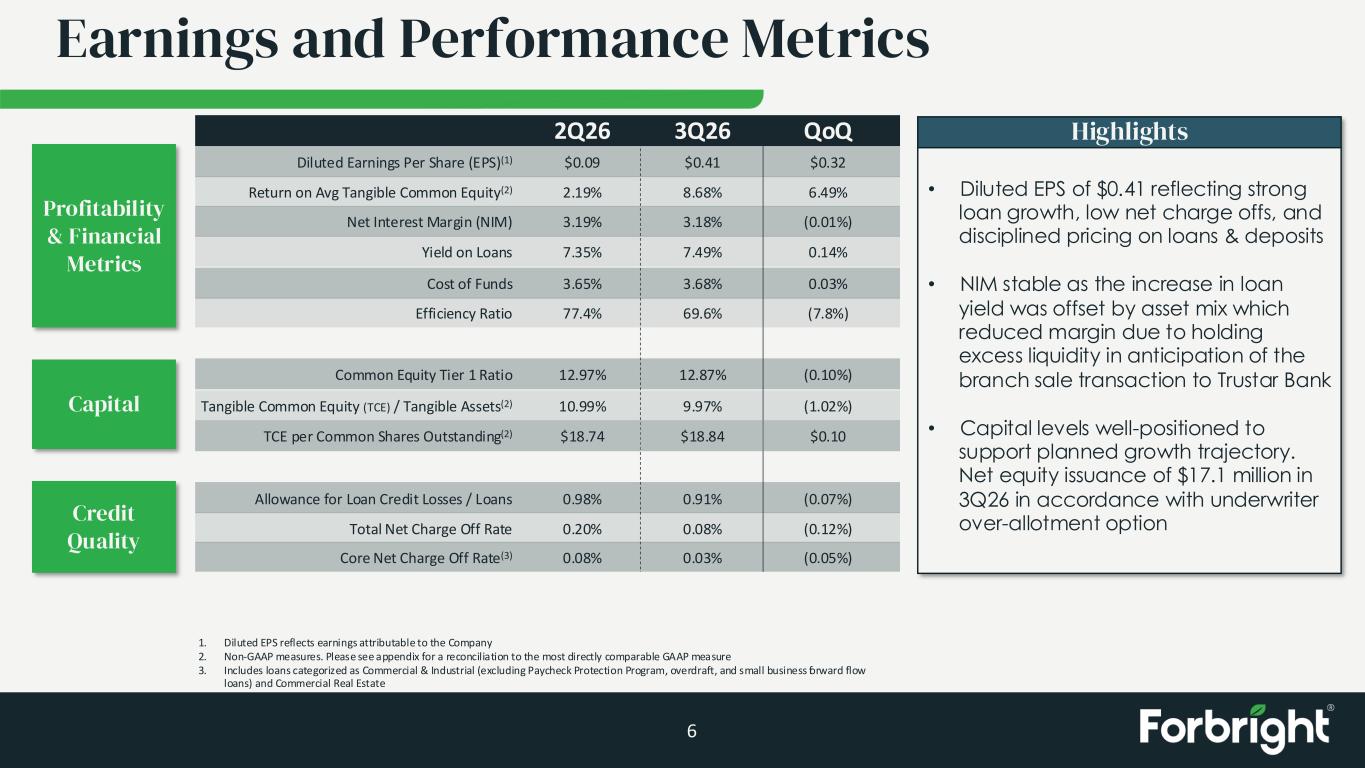
Earnings and Performance Metrics 6 Diluted Earnings Per Share (EPS)(1) Return on Avg Tangible Common Equity(2) Net Interest Margin (NIM) Common Equity Tier 1 Ratio Yield on Loans Cost of Funds Allowance for Loan Credit Losses / Loans Total Net Charge Off Rate Core Net Charge Off Rate(3) Tangible Common Equity (TCE) / Tangible Assets(2) 2Q26 QoQ $0.32 6.49% (0.01%) (0.10%) 0.14% 0.03% (0.07%) (0.12%) (0.05%) (1.02%) 3Q26 $0.41 8.68% 3.18% 12.87% 7.49% 3.68% 0.91% 0.08% 0.03% 9.97% Highlights • Diluted EPS of $0.41 reflecting strong loan growth, low net charge offs, and disciplined pricing on loans & deposits • NIM stable as the increase in loan yield was offset by asset mix which reduced margin due to holding excess liquidity in anticipation of the branch sale transaction to Trustar Bank • Capital levels well-positioned to support planned growth trajectory. Net equity issuance of $17.1 million in 3Q26 in accordance with underwriter over-allotment option Efficiency Ratio (7.8%)69.6% Profitability & Financial Metrics Capital Credit Quality TCE per Common Shares Outstanding(2) $0.10$18.84 1. Diluted EPS reflects earnings attributable to the Company 2. Non-GAAP measures. Please see appendix for a reconciliation to the most directly comparable GAAP measure 3. Includes loans categorized as Commercial & Industrial (excluding Paycheck Protection Program, overdraft, and small business forward flow loans) and Commercial Real Estate $0.09 2.19% 3.19% 12.97% 7.35% 3.65% 0.98% 0.20% 0.08% 10.99% 77.4% $18.74
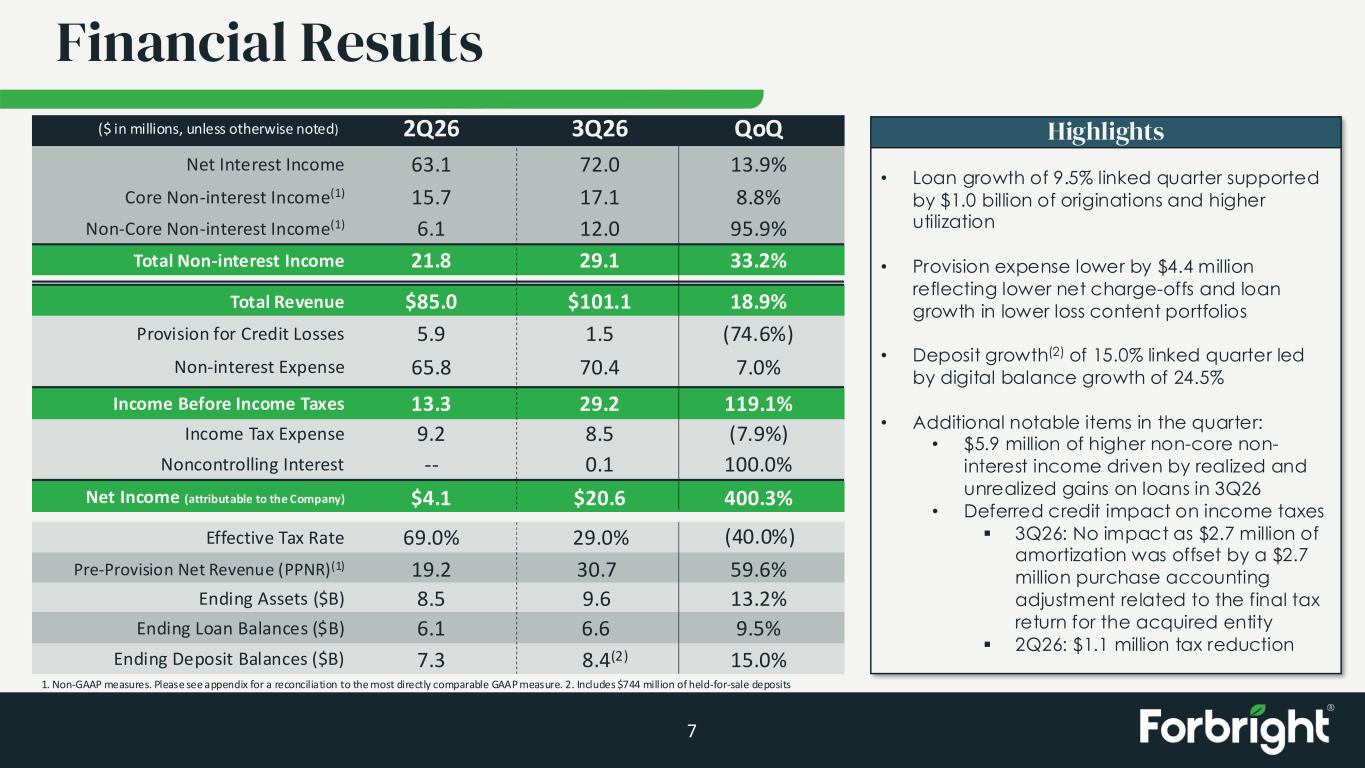
Non-interest Expense 65.8 7.0%70.4 Income Tax Expense 9.2 (7.9%)8.5 Net Income (attributable to the Company) $4.1 400.3%$20.6 Total Revenue $85.0 18.9%$101.1 Financial Results 7 ($ in millions, unless otherwise noted) 2Q26 QoQ3Q26 Net Interest Income 63.1 13.9%72.0 Non-Core Non-interest Income(1) 6.1 95.9%12.0 Total Non-interest Income 21.8 33.2%29.1 Highlights • Loan growth of 9.5% linked quarter supported by $1.0 billion of originations and higher utilization • Provision expense lower by $4.4 million reflecting lower net charge-offs and loan growth in lower loss content portfolios • Deposit growth(2) of 15.0% linked quarter led by digital balance growth of 24.5% • Additional notable items in the quarter: • $5.9 million of higher non-core non- interest income driven by realized and unrealized gains on loans in 3Q26 • Deferred credit impact on income taxes ▪ 3Q26: No impact as $2.7 million of amortization was offset by a $2.7 million purchase accounting adjustment related to the final tax return for the acquired entity ▪ 2Q26: $1.1 million tax reduction Core Non-interest Income(1) 15.7 8.8%17.1 Provision for Credit Losses 5.9 (74.6%)1.5 Pre-Provision Net Revenue (PPNR)(1) 19.2 59.6%30.7 Income Before Income Taxes 13.3 119.1%29.2 Ending Loan Balances ($B) 6.1 9.5%6.6 Ending Deposit Balances ($B) 7.3 15.0%8.4(2) Ending Assets ($B) 8.5 13.2%9.6 1. Non-GAAP measures. Please see appendix for a reconciliation to the most directly comparable GAAP measure. 2. Includes $744 million of held-for-sale deposits Effective Tax Rate 69.0% 29.0% (40.0%) Noncontrolling Interest -- 100.0%0.1
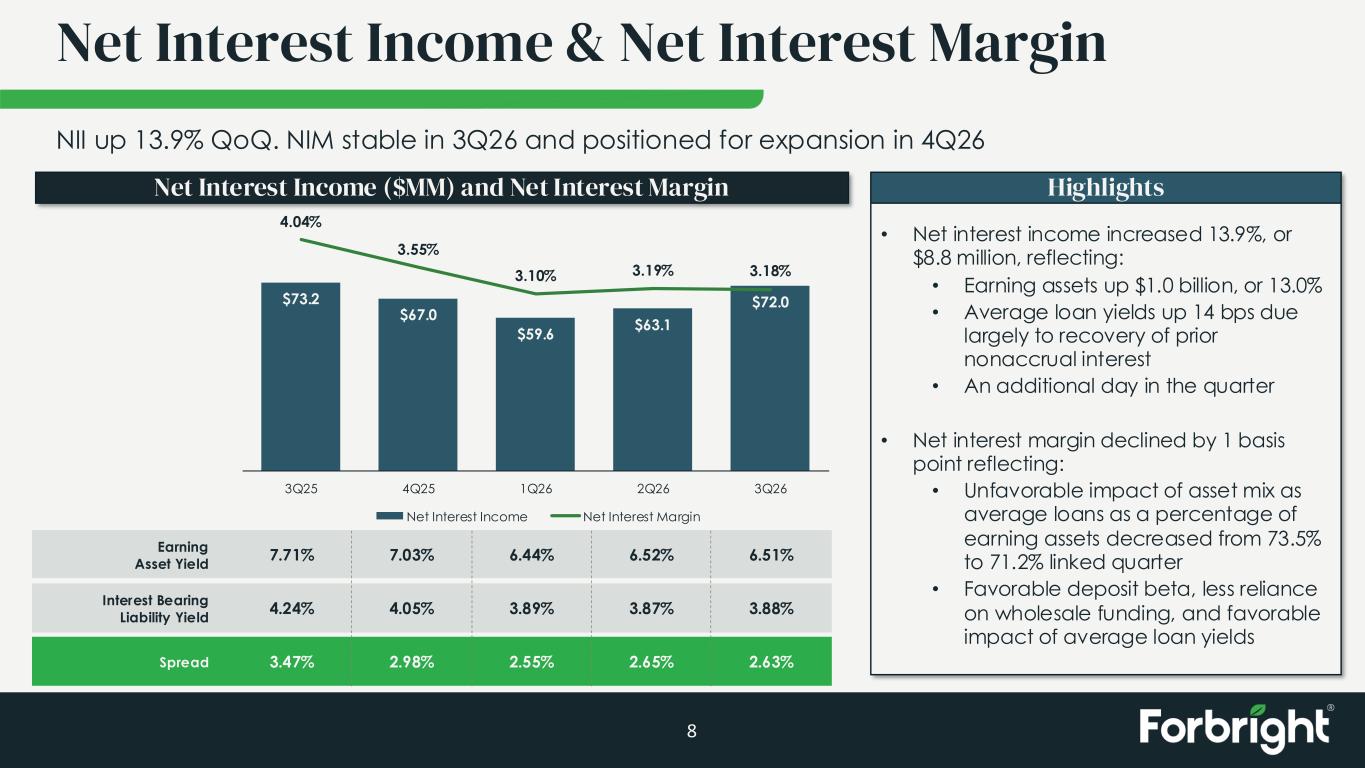
Net Interest Income & Net Interest Margin 8 HighlightsNet Interest Income ($MM) and Net Interest Margin Earning Asset Yield Interest Bearing Liability Yield Spread 7.71% 4.24% 3.47% • Net interest income increased 13.9%, or $8.8 million, reflecting: • Earning assets up $1.0 billion, or 13.0% • Average loan yields up 14 bps due largely to recovery of prior nonaccrual interest • An additional day in the quarter • Net interest margin declined by 1 basis point reflecting: • Unfavorable impact of asset mix as average loans as a percentage of earning assets decreased from 73.5% to 71.2% linked quarter • Favorable deposit beta, less reliance on wholesale funding, and favorable impact of average loan yields $73.2 $67.0 $59.6 $63.1 $72.0 4.04% 3.55% 3.10% 3.19% 3.18% 3Q25 4Q25 1Q26 2Q26 3Q26 Net Interest Income Net Interest Margin 7.03% 4.05% 2.98% 6.44% 3.89% 2.55% 6.52% 3.87% 2.65% 6.51% 3.88% 2.63% NII up 13.9% QoQ. NIM stable in 3Q26 and positioned for expansion in 4Q26
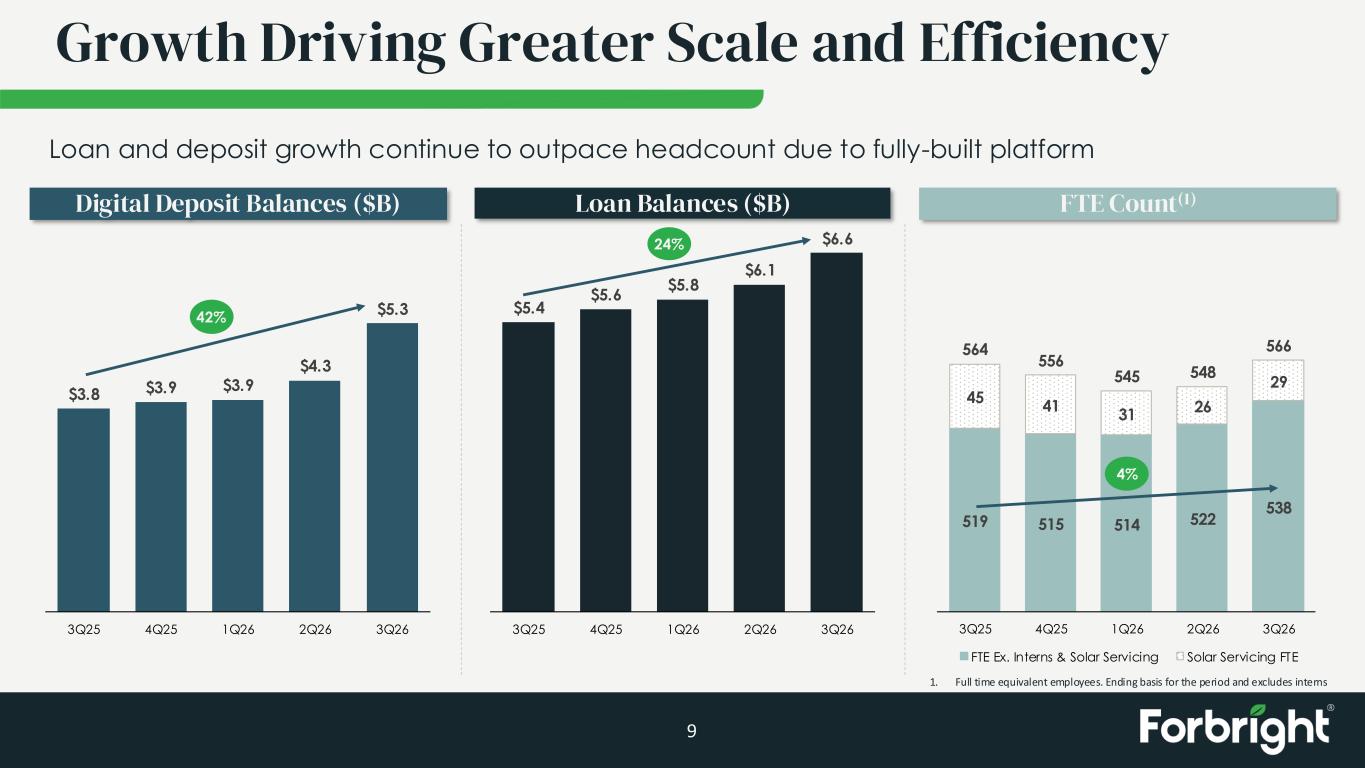
519 515 514 522 538 45 41 31 26 29 564 556 545 548 566 3Q25 4Q25 1Q26 2Q26 3Q26 FTE Ex. Interns & Solar Servicing Solar Servicing FTE $3.8 $3.9 $3.9 $4.3 $5.3 3Q25 4Q25 1Q26 2Q26 3Q26 $5.4 $5.6 $5.8 $6.1 $6.6 3Q25 4Q25 1Q26 2Q26 3Q26 Growth Driving Greater Scale and Efficiency 9 1. Full time equivalent employees. Ending basis for the period and excludes interns Loan and deposit growth continue to outpace headcount due to fully-built platform Digital Deposit Balances ($B) Loan Balances ($B) FTE Count(1) 24% 42% 4%
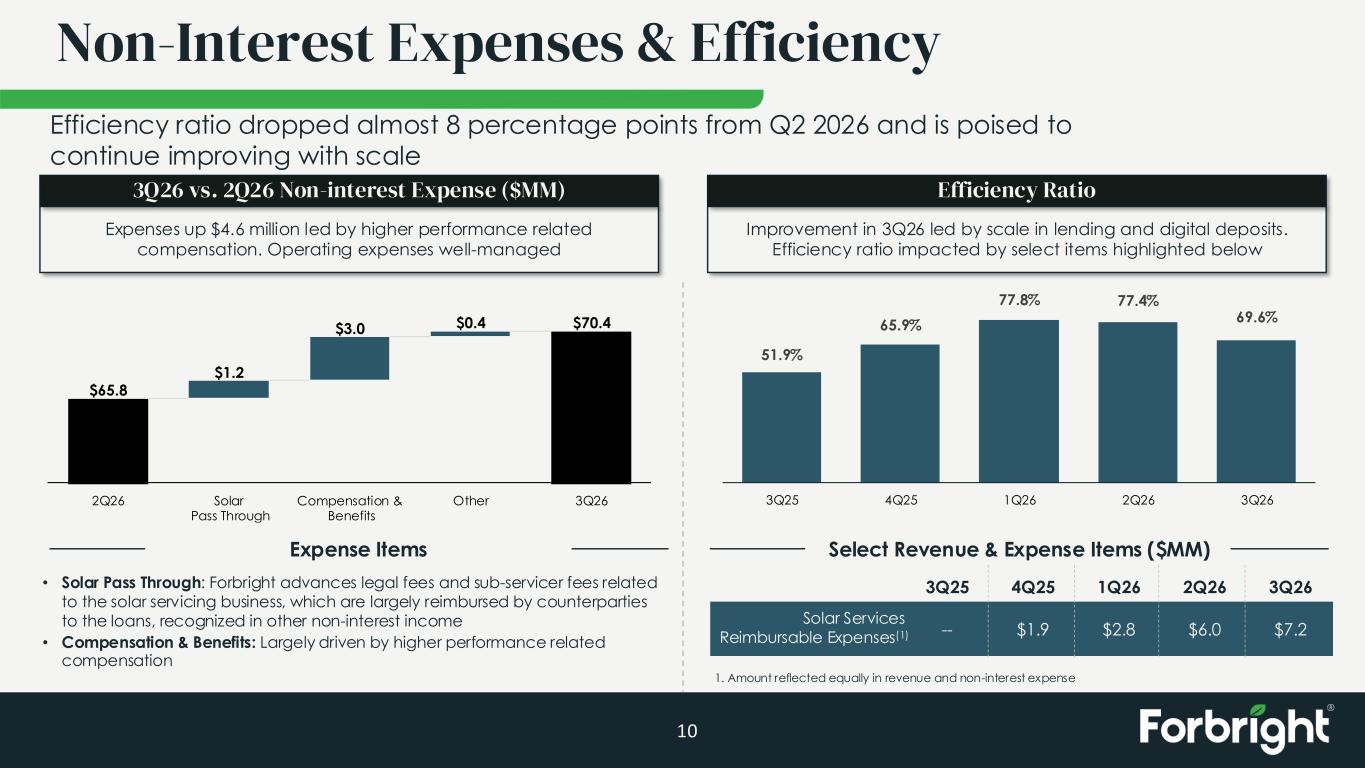
51.9% 65.9% 77.8% 77.4% 69.6% 3Q25 4Q25 1Q26 2Q26 3Q26 Non-Interest Expenses & Efficiency 10 Expenses up $4.6 million led by higher performance related compensation. Operating expenses well-managed 3Q26 vs. 2Q26 Non-interest Expense ($MM) Improvement in 3Q26 led by scale in lending and digital deposits. Efficiency ratio impacted by select items highlighted below Efficiency Ratio Select Revenue & Expense Items ($MM) Solar Services Reimbursable Expenses(1) 3Q25 -- 4Q25 $1.9 1Q26 $2.8 2Q26 $6.0 3Q26 $7.2 1. Amount reflected equally in revenue and non-interest expense • Solar Pass Through: Forbright advances legal fees and sub-servicer fees related to the solar servicing business, which are largely reimbursed by counterparties to the loans, recognized in other non-interest income • Compensation & Benefits: Largely driven by higher performance related compensation Expense Items Efficiency ratio dropped almost 8 percentage points from Q2 2026 and is poised to continue improving with scale $65.8 $1.2 $3.0 $0.4 $70.4 2Q26 Solar Pass Through Compensation & Benefits Other 3Q26
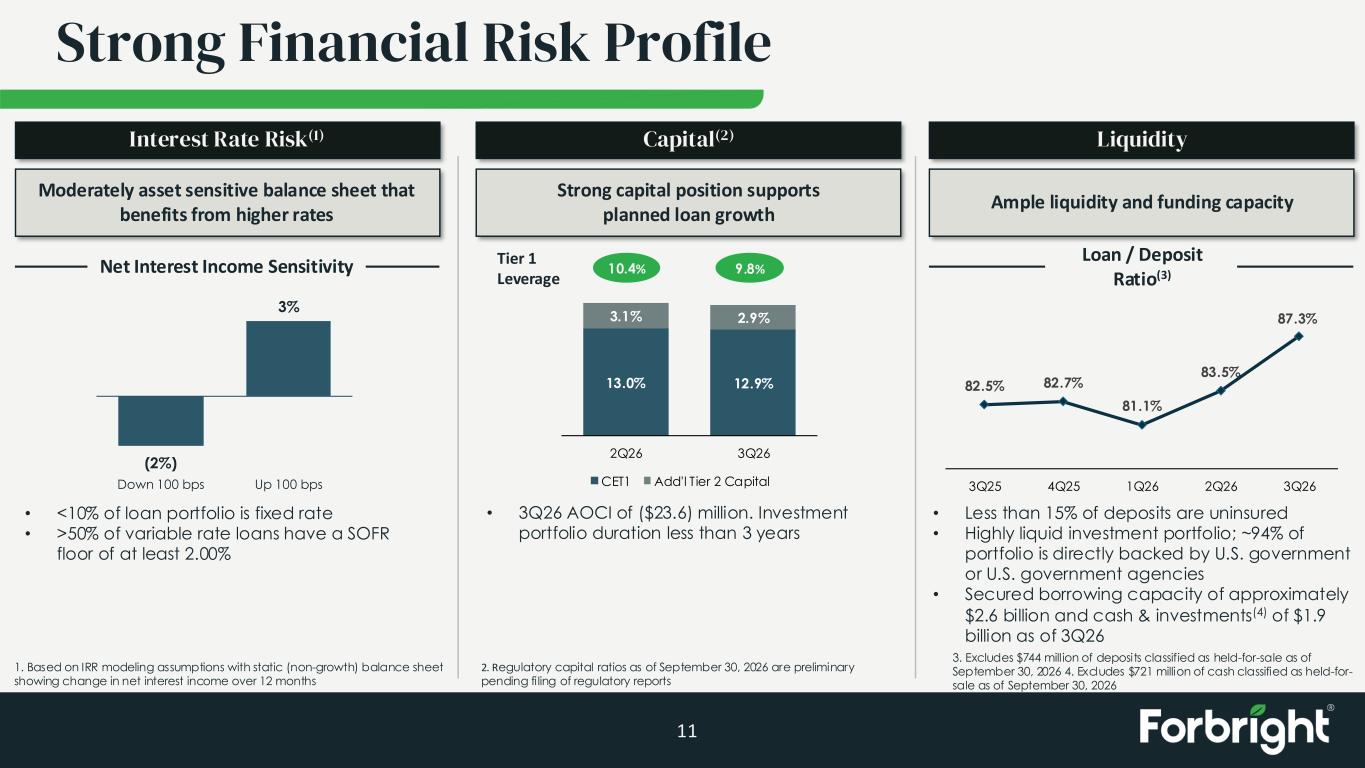
13.0% 12.9% 3.1% 2.9% 2Q26 3Q26 CET1 Add'l Tier 2 Capital Strong Financial Risk Profile 11 Capital(2) Strong capital position supports planned loan growth 2. Regulatory capital ratios as of September 30, 2026 are preliminary pending filing of regulatory reports Liquidity Ample liquidity and funding capacity 1. Based on IRR modeling assumptions with static (non-growth) balance sheet showing change in net interest income over 12 months Interest Rate Risk(1) Moderately asset sensitive balance sheet that benefits from higher rates 82.5% 82.7% 81.1% 83.5% 87.3% 3Q25 4Q25 1Q26 2Q26 3Q26 Loan / Deposit Ratio(3) • Less than 15% of deposits are uninsured • Highly liquid investment portfolio; ~94% of portfolio is directly backed by U.S. government or U.S. government agencies • Secured borrowing capacity of approximately $2.6 billion and cash & investments(4) of $1.9 billion as of 3Q26 • 3Q26 AOCI of ($23.6) million. Investment portfolio duration less than 3 years Tier 1 Leverage 9.8%10.4%Net Interest Income Sensitivity • <10% of loan portfolio is fixed rate • >50% of variable rate loans have a SOFR floor of at least 2.00% 3. Excludes $744 mill ion of deposits classified as held-for-sale as of September 30, 2026 4. Excludes $721 million of cash classified as held-for- sale as of September 30, 2026 (2%) 3% Down 100 bps Up 100 bps

Lending, Credit, and Fee Businesses 12
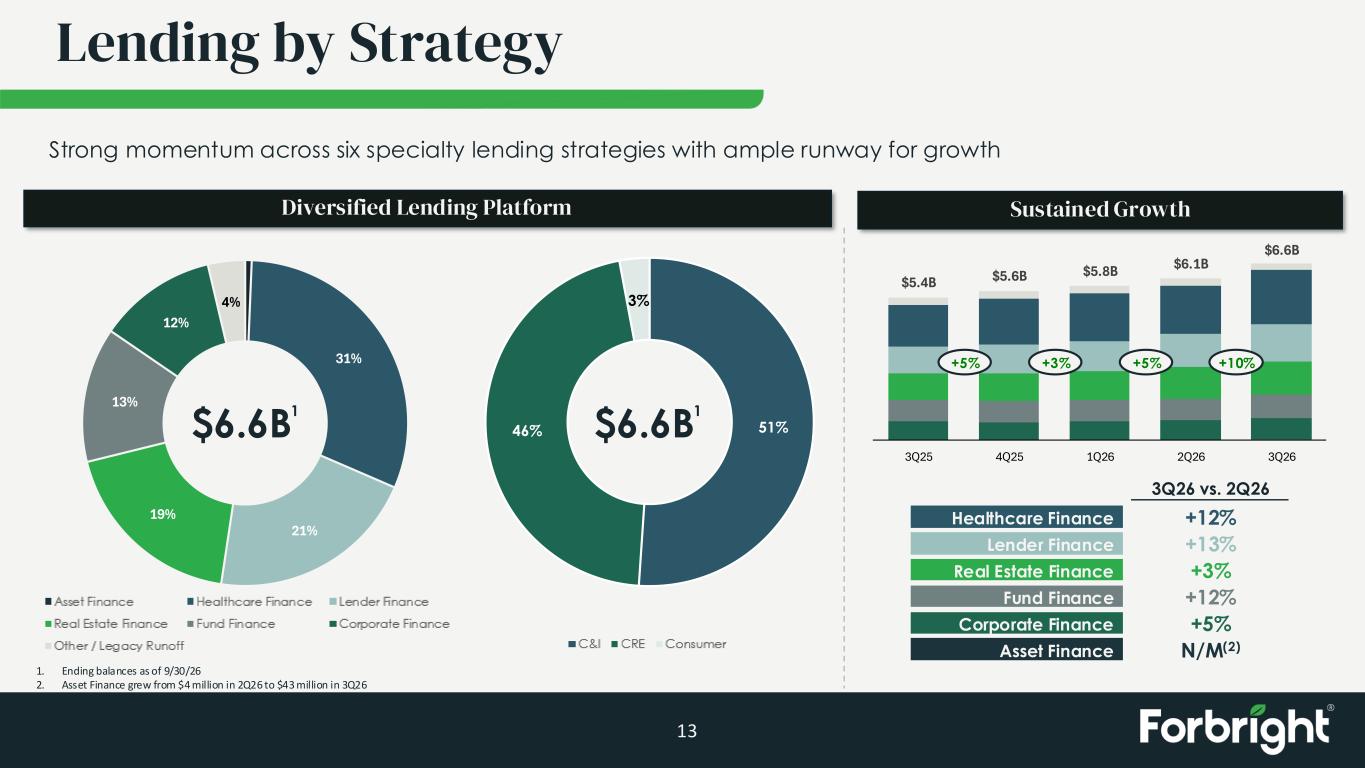
$5.4B $5.6B $5.8B $6.1B $6.6B 3Q25 4Q25 1Q26 2Q26 3Q26 51%46% 3% C&I CRE Consumer Lending by Strategy 13 Diversified Lending Platform Sustained Growth +5% +3% +5% Lender Finance Real Estate Finance Fund Finance Corporate Finance Healthcare Finance 3Q26 vs. 2Q26 +12% +13% +3% +12% +5% 1. Ending balances as of 9/30/26 2. Asset Finance grew from $4 million in 2Q26 to $43 million in 3Q26 Strong momentum across six specialty lending strategies with ample runway for growth $6.6B 1 $6.6B 1 31% 21% 19% 13% 12% 4% Asset Finance Healthcare Finance Lender Finance Real Estate Finance Fund Finance Corporate Finance Other / Legacy Runoff +10% Asset Finance N/M(2)
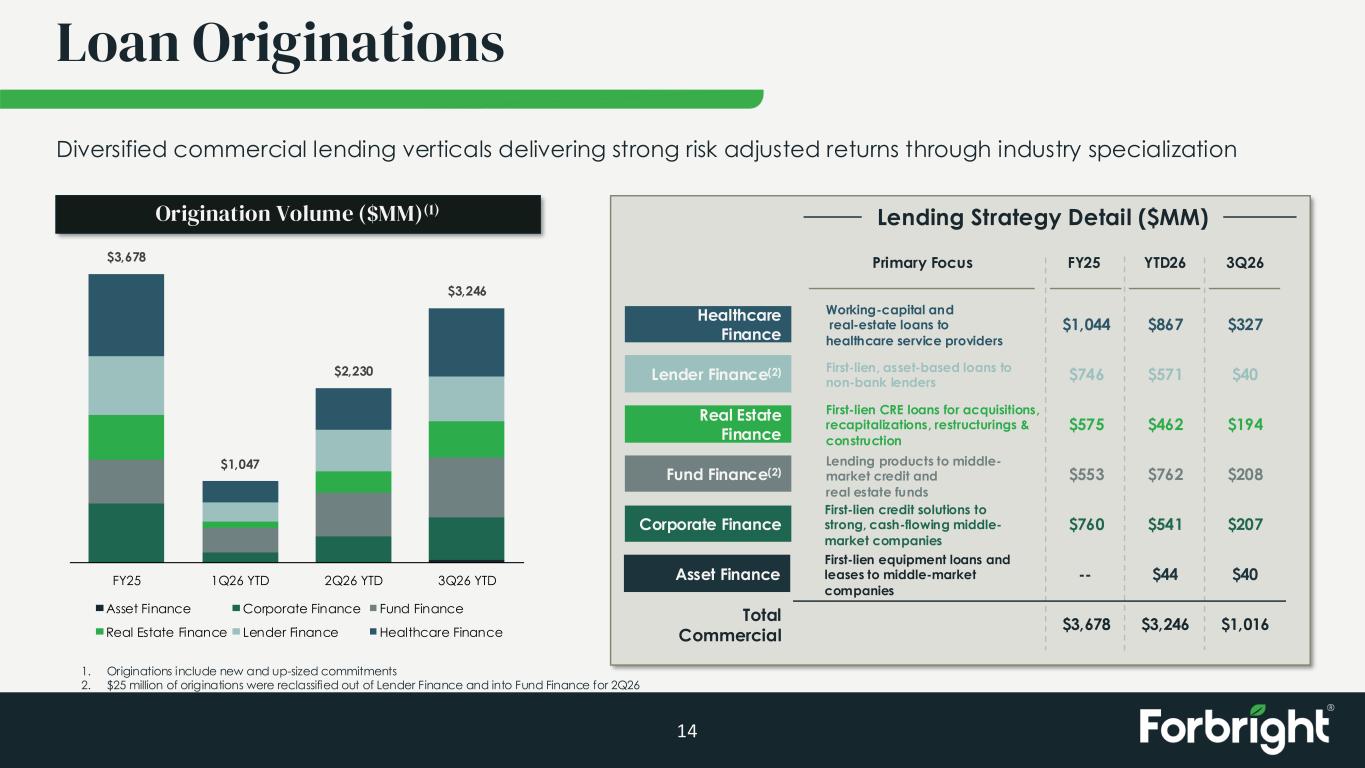
Loan Originations 14 Origination Volume ($MM)(1) Lender Finance(2) Real Estate Finance Fund Finance(2) Corporate Finance Healthcare Finance Primary Focus Lending Strategy Detail ($MM) FY25 YTD26 3Q26 Total Commercial Working-capital and real-estate loans to healthcare service providers First-lien, asset-based loans to non-bank lenders First-lien CRE loans for acquisitions, recapitalizations, restructurings & construction Lending products to middle- market credit and real estate funds First-lien credit solutions to strong, cash-flowing middle- market companies $1,044 $746 $575 $553 $760 $3,678 $867 $571 $462 $762 $541 $3,246 $327 $40 $194 $208 $207 $1,016 Asset Finance First-lien equipment loans and leases to middle-market companies -- $44 $40 Diversified commercial lending verticals delivering strong risk adjusted returns through industry specialization 1. Originations include new and up-sized commitments 2. $25 million of originations were reclassified out of Lender Finance and into Fund Finance for 2Q26 $3,678 $1,047 $2,230 $3,246 FY25 1Q26 YTD 2Q26 YTD 3Q26 YTD Asset Finance Corporate Finance Fund Finance Real Estate Finance Lender Finance Healthcare Finance
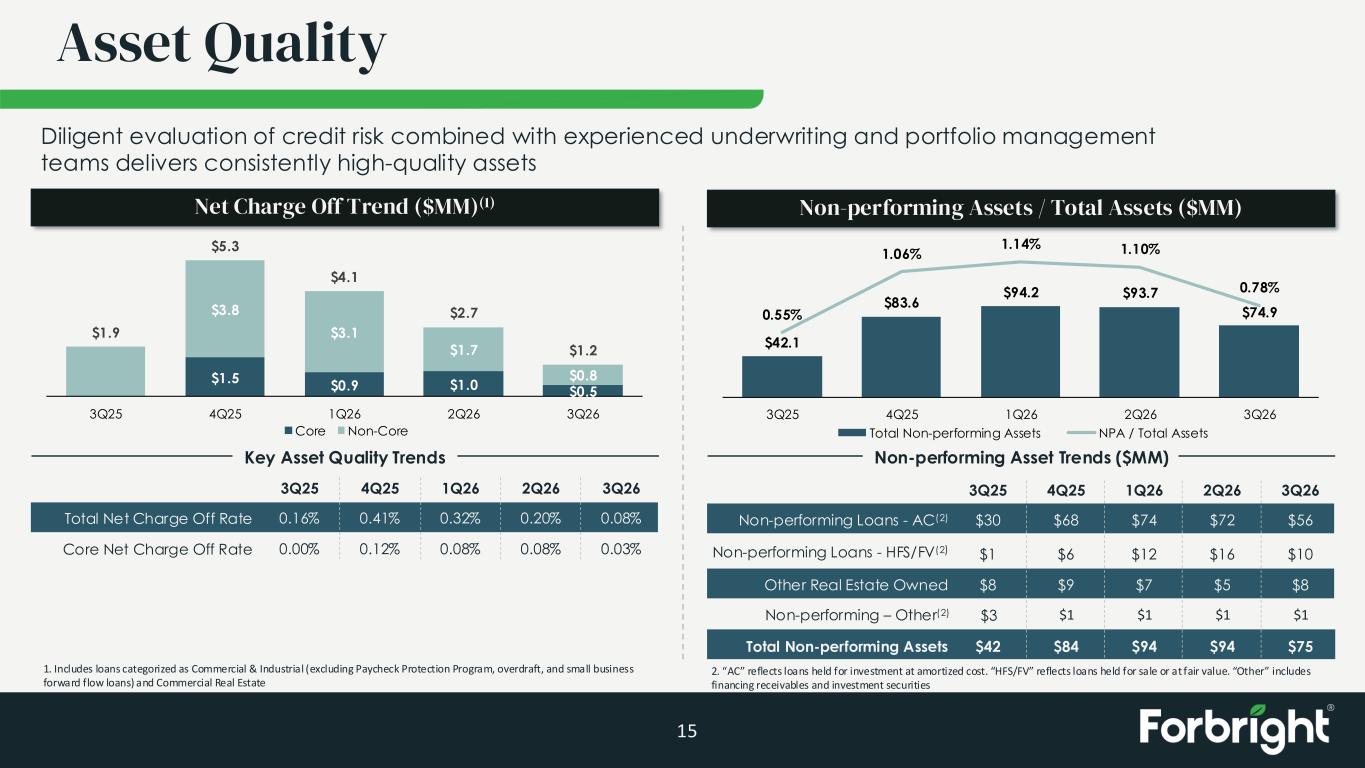
$1.5 $0.9 $1.0 $0.5 $3.8 $3.1 $1.7 $0.8 $1.9 $5.3 $4.1 $2.7 $1.2 3Q25 4Q25 1Q26 2Q26 3Q26 Core Non-Core $42.1 $83.6 $94.2 $93.7 $74.90.55% 1.06% 1.14% 1.10% 0.78% 3Q25 4Q25 1Q26 2Q26 3Q26 Total Non-performing Assets NPA / Total Assets Asset Quality 15 Key Asset Quality Trends Total Net Charge Off Rate Core Net Charge Off Rate 3Q25 0.16% 0.00% 4Q25 0.41% 0.12% 1Q26 0.32% 0.08% 2Q26 0.20% 0.08% Non-performing Asset Trends ($MM) Non-performing Loans - AC(2) Other Real Estate Owned Net Charge Off Trend ($MM)(1) Non-performing Assets / Total Assets ($MM) 1. Includes loans categorized as Commercial & Industrial (excluding Paycheck Protection Program, overdraft, and small business forward flow loans) and Commercial Real Estate Diligent evaluation of credit risk combined with experienced underwriting and portfolio management teams delivers consistently high-quality assets 3Q25 $30 $8 $1 4Q25 $68 $9 $6 1Q26 $74 $7 $12 2Q26 $72 $5 $16Non-performing Loans - HFS/FV(2) 3Q26 0.08% 0.03% 3Q26 $56 $8 $10 Total Non-performing Assets $42 $84 $94 $94 $75 $3 $1 $1 $1Non-performing – Other(2) $1 2. “AC” reflects loans held for investment at amortized cost. “HFS/FV” reflects loans held for sale or at fair value. “Other” includes financing receivables and investment securities
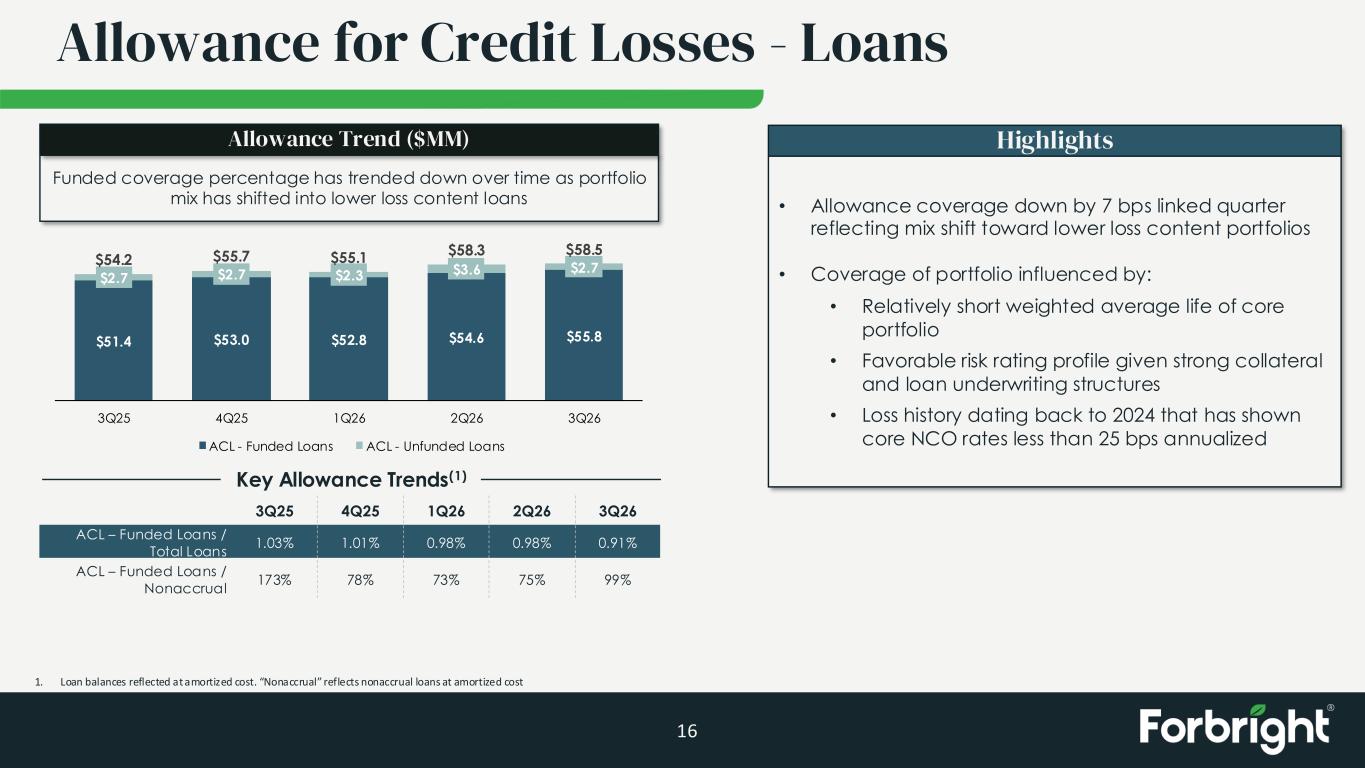
Allowance for Credit Losses - Loans 16 Key Allowance Trends(1) ACL – Funded Loans / Total Loans ACL – Funded Loans / Nonaccrual 3Q25 1.03% 173% 4Q25 1.01% 78% 1Q26 0.98% 73% 2Q26 0.98% 75% Funded coverage percentage has trended down over time as portfolio mix has shifted into lower loss content loans Allowance Trend ($MM) 1. Loan balances reflected at amortized cost. “Nonaccrual” reflects nonaccrual loans at amortized cost $51.4 $53.0 $52.8 $54.6 $55.8 $2.7 $2.7 $2.3 $3.6 $2.7 $54.2 $55.7 $55.1 $58.3 $58.5 3Q25 4Q25 1Q26 2Q26 3Q26 ACL - Funded Loans ACL - Unfunded Loans 3Q26 0.91% 99% Highlights • Allowance coverage down by 7 bps linked quarter reflecting mix shift toward lower loss content portfolios • Coverage of portfolio influenced by: • Relatively short weighted average life of core portfolio • Favorable risk rating profile given strong collateral and loan underwriting structures • Loss history dating back to 2024 that has shown core NCO rates less than 25 bps annualized
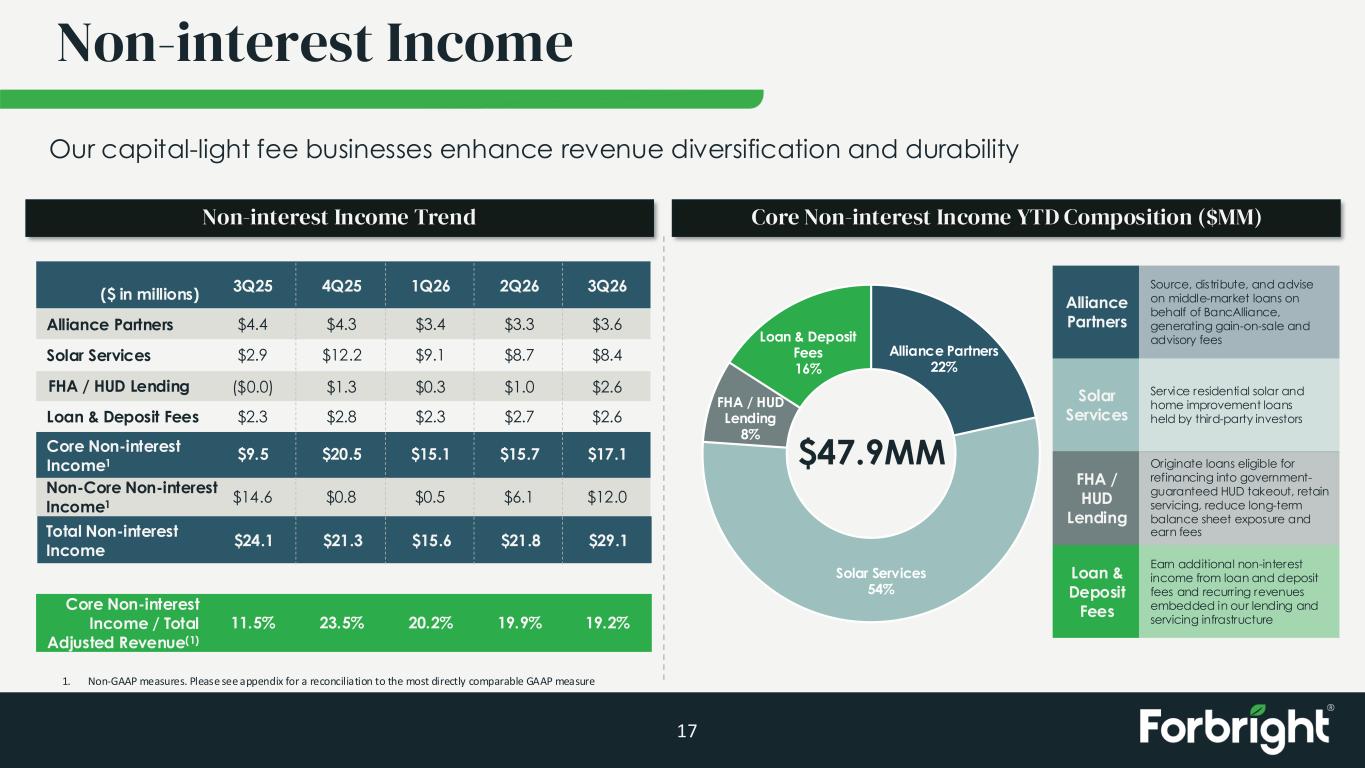
Alliance Partners 22% Solar Services 54% FHA / HUD Lending 8% Loan & Deposit Fees 16% Non-interest Income 17 Our capital-light fee businesses enhance revenue diversification and durability $47.9MM Alliance Partners Solar Services Loan & Deposit Fees FHA / HUD Lending Core Non-interest Income1 ($ in millions) Core Non-interest Income / Total Adjusted Revenue(1) Non-interest Income Trend Core Non-interest Income YTD Composition ($MM) Non-Core Non-interest Income1 3Q25 $4.4 $2.9 ($0.0) $2.3 $9.5 11.5% $14.6 $24.1 Total Non-interest Income 4Q25 $4.3 $12.2 $1.3 $2.8 $20.5 23.5% $0.8 $21.3 1Q26 $3.4 $9.1 $0.3 $2.3 $15.1 20.2% $0.5 $15.6 2Q26 $3.3 $8.7 $1.0 $2.7 $15.7 19.9% $6.1 $21.8 3Q26 $3.6 $8.4 $2.6 $2.6 $17.1 19.2% $12.0 $29.1 Alliance Partners Solar Services FHA / HUD Lending Loan & Deposit Fees Source, distribute, and advise on middle-market loans on behalf of BancAlliance, generating gain-on-sale and advisory fees Service residential solar and home improvement loans held by third-party investors Originate loans eligible for refinancing into government- guaranteed HUD takeout, retain servicing, reduce long-term balance sheet exposure and earn fees Earn additional non-interest income from loan and deposit fees and recurring revenues embedded in our lending and servicing infrastructure 1. Non-GAAP measures. Please see appendix for a reconciliation to the most directly comparable GAAP measure

Deposits 18
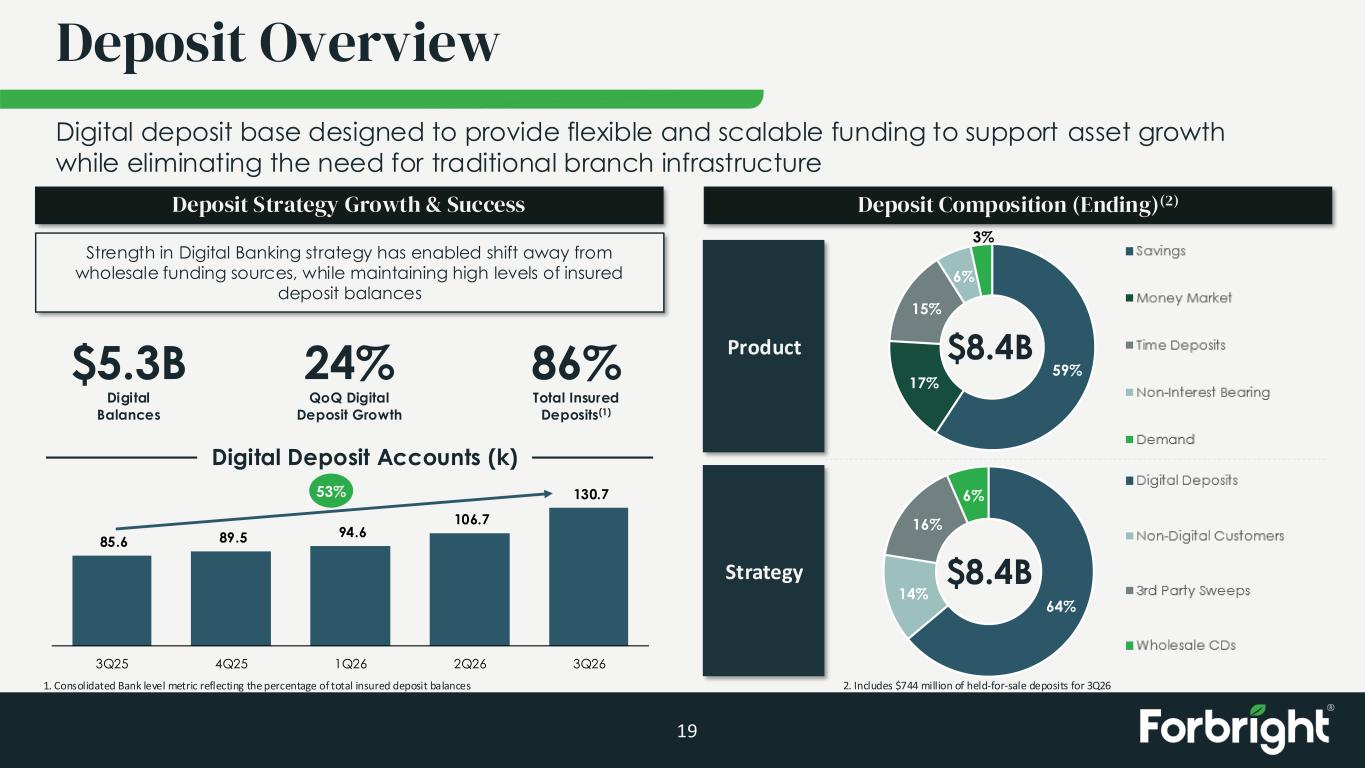
64% 14% 16% 6% Digital Deposits Non-Digital Customers 3rd Party Sweeps Wholesale CDs 59% 17% 15% 6% 3% Savings Money Market Time Deposits Non-Interest Bearing Demand 85.6 89.5 94.6 106.7 130.7 3Q25 4Q25 1Q26 2Q26 3Q26 Deposit Overview 19 1. Consolidated Bank level metric reflecting the percentage of total insured deposit balances Deposit Strategy Growth & Success Strength in Digital Banking strategy has enabled shift away from wholesale funding sources, while maintaining high levels of insured deposit balances $5.3B Digital Balances 86% Total Insured Deposits(1) Digital Deposit Accounts (k) Deposit Composition (Ending)(2) Product Strategy $8.4B 24% QoQ Digital Deposit Growth Digital deposit base designed to provide flexible and scalable funding to support asset growth while eliminating the need for traditional branch infrastructure $8.4B 53% 2. Includes $744 million of held-for-sale deposits for 3Q26
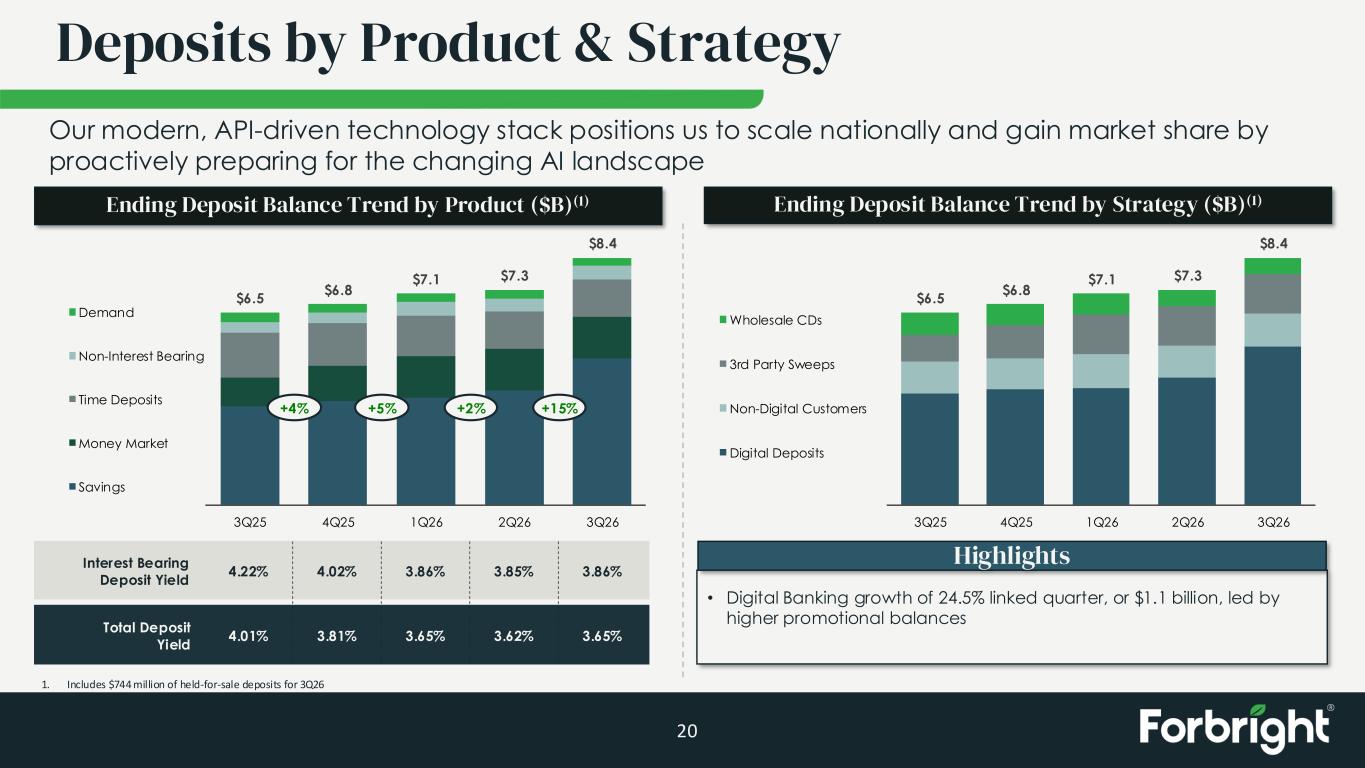
$6.5 $6.8 $7.1 $7.3 $8.4 3Q25 4Q25 1Q26 2Q26 3Q26 Demand Non-Interest Bearing Time Deposits Money Market Savings Deposits by Product & Strategy 20 Ending Deposit Balance Trend by Product ($B)(1) Interest Bearing Deposit Yield Total Deposit Yield 4.22% 4.01% 4.02% 3.81% 3.86% 3.65% 3.85% 3.62% Ending Deposit Balance Trend by Strategy ($B)(1) • Digital Banking growth of 24.5% linked quarter, or $1.1 billion, led by higher promotional balances Our modern, API-driven technology stack positions us to scale nationally and gain market share by proactively preparing for the changing AI landscape +4% +5% +2% Highlights +15% 3.86% 3.65% $6.5 $6.8 $7.1 $7.3 $8.4 3Q25 4Q25 1Q26 2Q26 3Q26 Wholesale CDs 3rd Party Sweeps Non-Digital Customers Digital Deposits 1. Includes $744 million of held-for-sale deposits for 3Q26

Appendix 21
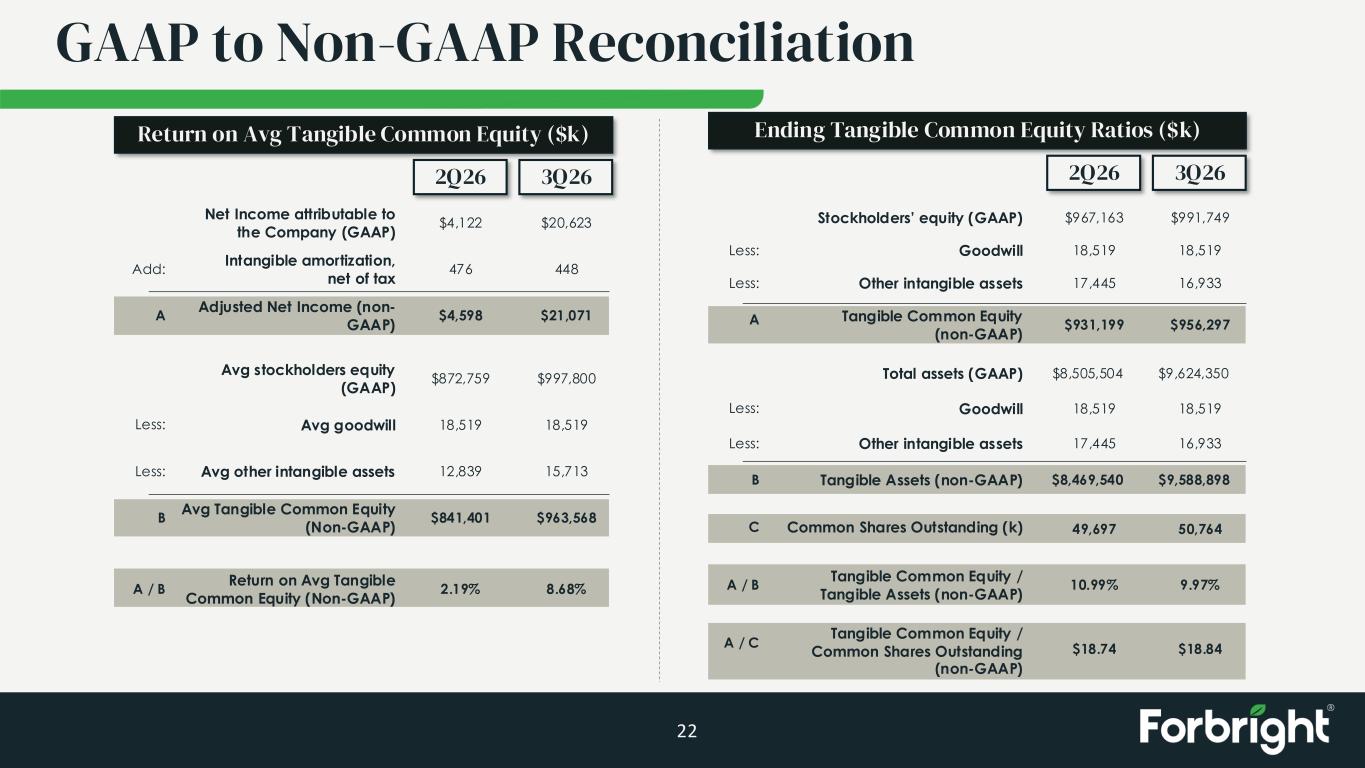
GAAP to Non-GAAP Reconciliation 22 2Q26 3Q26 Stockholders’ equity (GAAP) $967,163 $991,749 Total assets (GAAP) $8,505,504 $9,624,350 Tangible Common Equity / Tangible Assets (non-GAAP) 10.99% 9.97% Goodwill 18,519 18,519Less: Goodwill 18,519 18,519Less: Other intangible assets 17,445 16,933Less: Tangible Common Equity (non-GAAP) $931,199 $956,297A Tangible Assets (non-GAAP) $8,469,540 $9,588,898B A / B Ending Tangible Common Equity Ratios ($k) Other intangible assets 17,445 16,933Less: Common Shares Outstanding (k) 49,697 50,764C Tangible Common Equity / Common Shares Outstanding (non-GAAP) $18.74 $18.84A / C 2Q26 3Q26 Net Income attributable to the Company (GAAP) Intangible amortization, net of tax Adjusted Net Income (non- GAAP) $4,122 476 $4,598 $20,623 448 $21,071 Avg stockholders equity (GAAP) $872,759 $997,800 Avg goodwill 18,519 18,519 Avg other intangible assets 12,839 15,713 Avg Tangible Common Equity (Non-GAAP) $841,401 $963,568 Return on Avg Tangible Common Equity (Non-GAAP) 2.19% 8.68% Add: Less: Less: A B A / B Return on Avg Tangible Common Equity ($k)
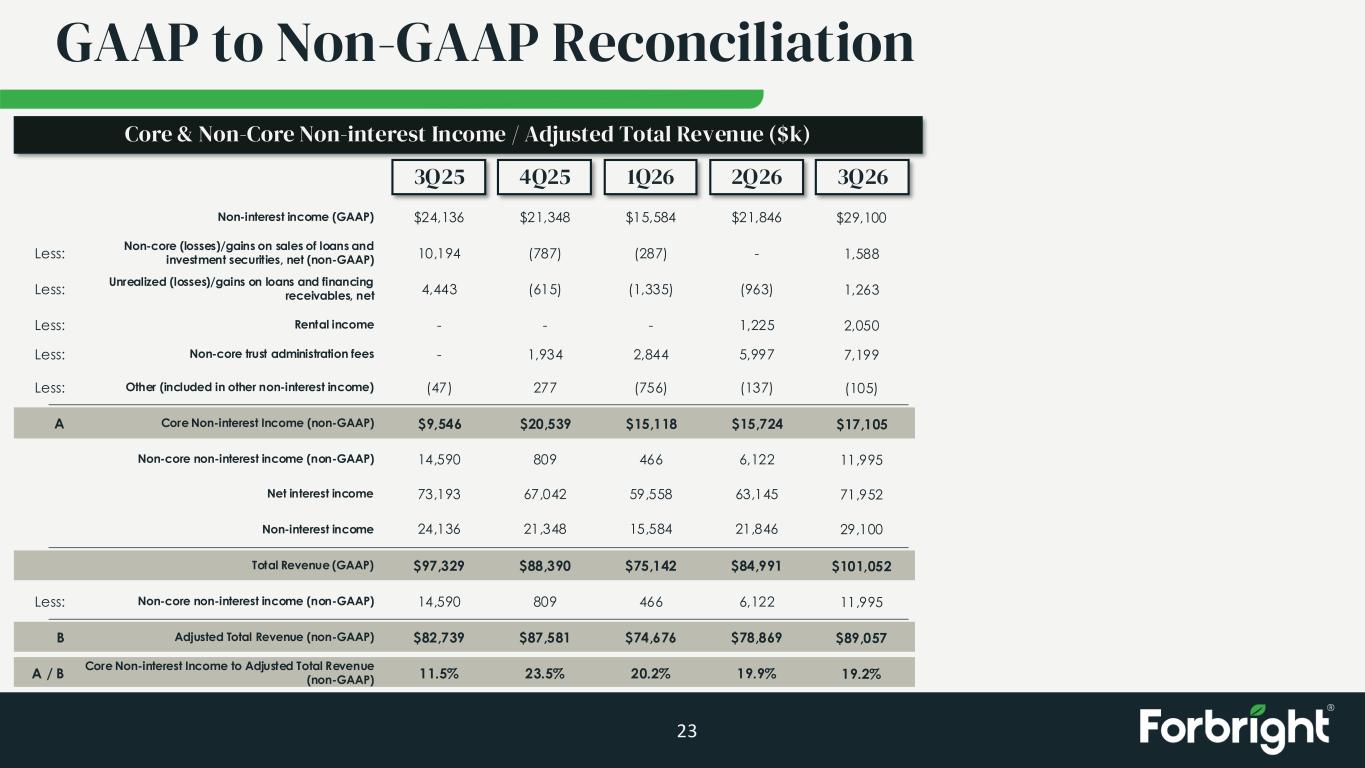
GAAP to Non-GAAP Reconciliation 23 3Q25 4Q25 1Q26 2Q26 Non-interest income (GAAP) Non-core (losses)/gains on sales of loans and investment securities, net (non-GAAP) Unrealized (losses)/gains on loans and financing receivables, net Rental income Other (included in other non-interest income) Core Non-interest Income (non-GAAP) Non-core non-interest income (non-GAAP) $24,136 $21,348 Net interest income Non-interest income Total Revenue (GAAP) Non-core non-interest income (non-GAAP) Adjusted Total Revenue (non-GAAP) Core Non-interest Income to Adjusted Total Revenue (non-GAAP) $15,584 $21,846 10,194 (787) (287) - 4,443 (615) (1,335) (963) - - - 1,225 Less: Less: Less: Less: (47) 277 (756) (137) $9,546 $20,539 $15,118 $15,724 14,590 809 466 6,122 73,193 67,042 59,558 63,145 24,136 21,348 15,584 21,846 $97,329 $88,390 $75,142 $84,991 14,590 809 466 6,122 $82,739 $87,581 $74,676 $78,869 Less: A B A / B 11.5% 23.5% 20.2% 19.9% Core & Non-Core Non-interest Income / Adjusted Total Revenue ($k) 3Q26 $29,100 1,588 1,263 2,050 (105) $17,105 11,995 71,952 29,100 $101,052 11,995 $89,057 19.2% Non-core trust administration feesLess: - 1,934 2,844 5,997 7,199
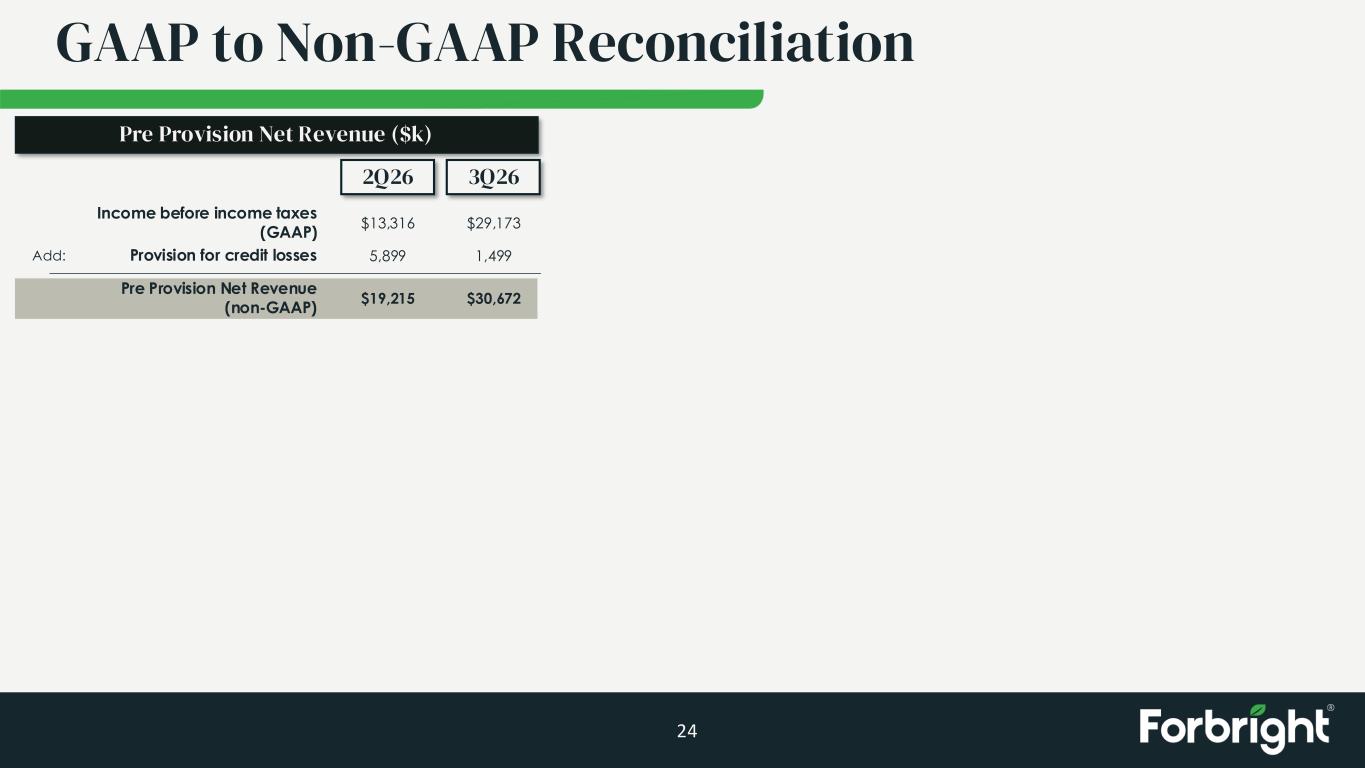
GAAP to Non-GAAP Reconciliation 24 2Q26 3Q26 Income before income taxes (GAAP) $13,316 $29,173 Provision for credit losses 5,899 1,499Add: Pre Provision Net Revenue (non-GAAP) $19,215 $30,672 Pre Provision Net Revenue ($k)